Methodology
Climate Models
Climate models are used to improve understanding on climate systems by simulating the historical period,
the present and also the future climate which depends on greenhouse gas scenarios. They are also used to perform seasonal forecasts.
There are a number of climate models available, however, for this study 2 climate models (Mk3.5 and ECHAM5) were used under CMIP3 while 4 climate models were used under CMIP5 which were CNRM-CM5, HadGEM2-ES, INMCM4 and ACCESS1.0.
These 4 models were chosen due to the availability of relatively high spatial resolution and high (3 hrs) temporal resolution data. These were also the most up to date models.
CIMP?
To provide some background on CMIP; CMIP stands for Coupled Model Intercomparison Project.
It was first launched in 1995 under the Working Group on Coupled Modelling (WGCM) for studying the output of coupled atmosphere – ocean general circulation models.
CMIP3 (Coupled Model Intercomparison Project Phase 3) was launched in the early 2000 and there were 23 coupled models developed in different countries under this project phase.
This was the model ensemble for IPCC (AR4).
CMIP5 (Coupled Model Intercomparison Project Phase 5) was launched in early 2011 and the outputs of the climate change experiments were available in the IPCC AR5.
There were 2 concentration pathways used under the CMIP5 model. These were RCP 4.5 which is a medium low emission scenario and RCP 8.5 which is high emission scenario.
Wave models
Climate models do not typically include a full spectral wave model as these are too computationally expensive to be directly included.
However the climate model output all the climate parameters we need to run a wave model.
the wave models are run with the forcing of each climate models creating a large amount of wave information.
The nearshore wave model used to simulte the wave climate for Rarotonga, Cook Islands (Here). was used to simulate the future changes in the wave climate by appliying the regional wave changes to the present wave climate boundary conditions.
For this wave climate change page, we are only showing the outputs for the CMIP5 ensemble as these were more relevant.
20 year periods were chosen for each time frame; historical (1986:2005), Mid 21st Century (MID21C, 2026:2045) and End 21st Century (END21C, 2081:2100).
The ensemble average was calculated for each time frame and the difference between the projected and the historical scenarios were calculated in order to obtain the projected changes.
The projected changes were calculated for 3 variable which were Significant wave height (Hs), Peak Wave Period (Tp) and Peak Wave Direction (Dp).
In the slide shows below, you will be able to see the Hs changes for both scenarios (RCP 4.5 and 8.5) and only RCP8.5 changes for Dp and Tp.
Results
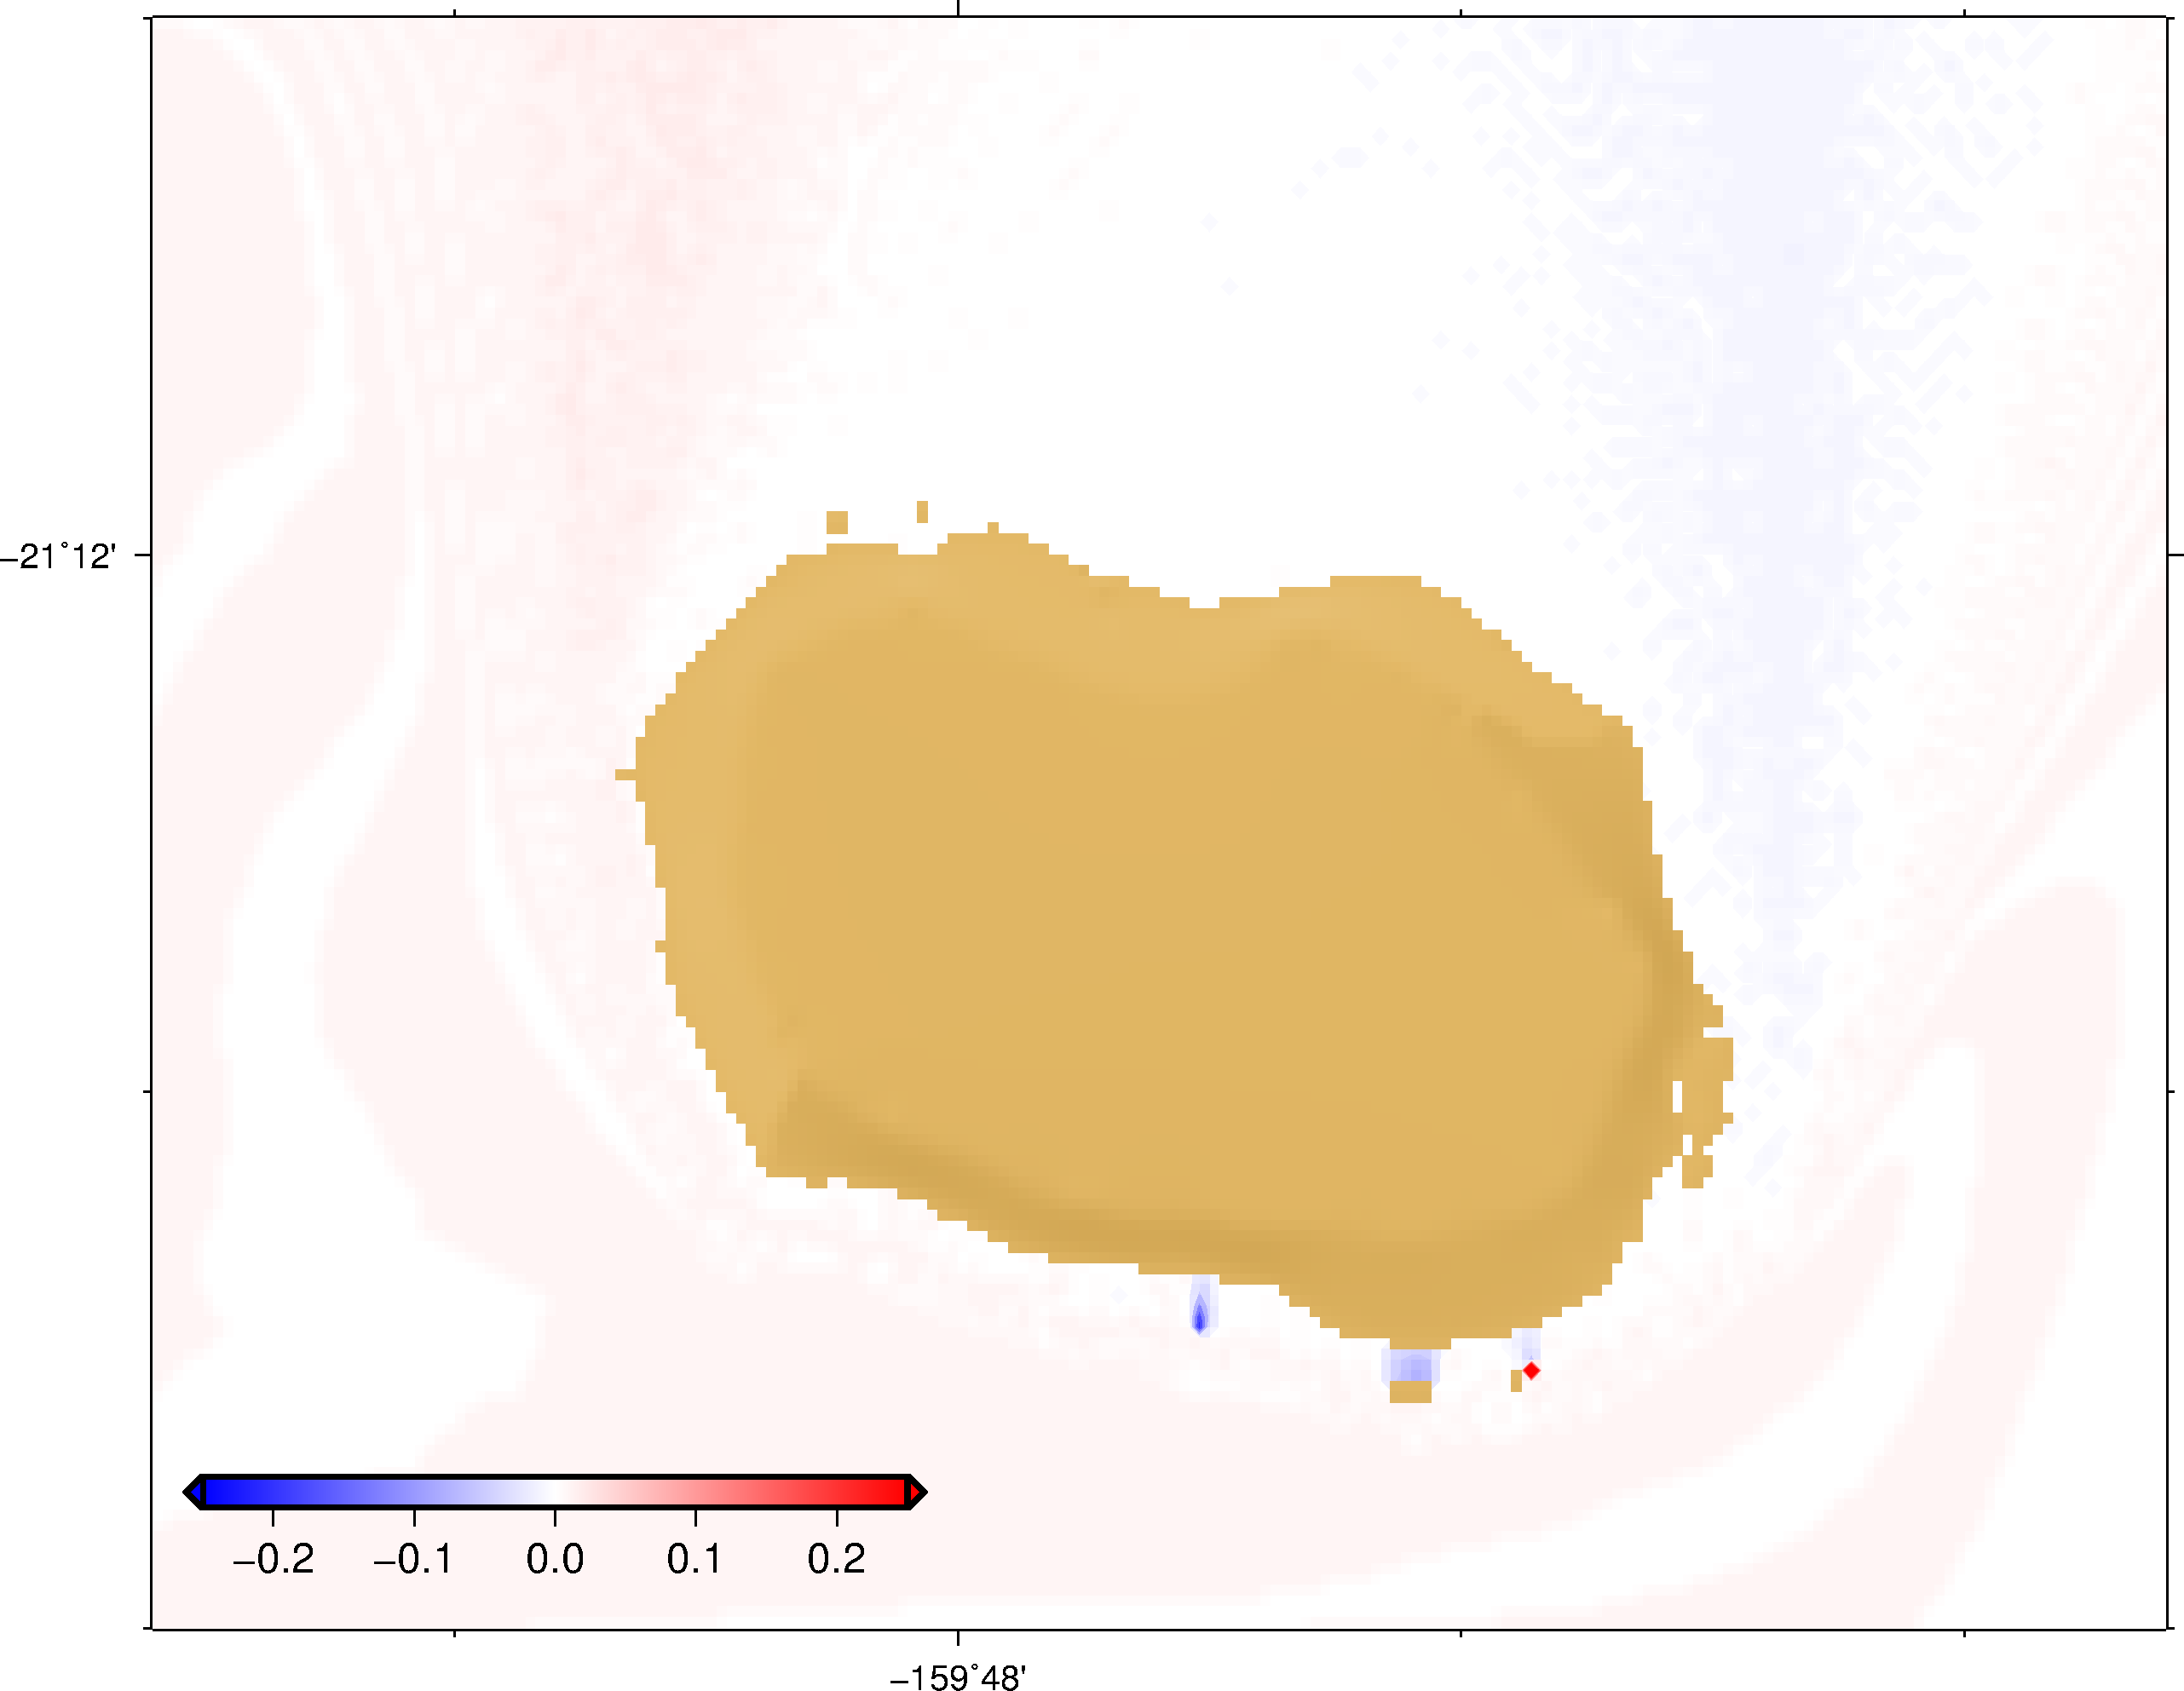
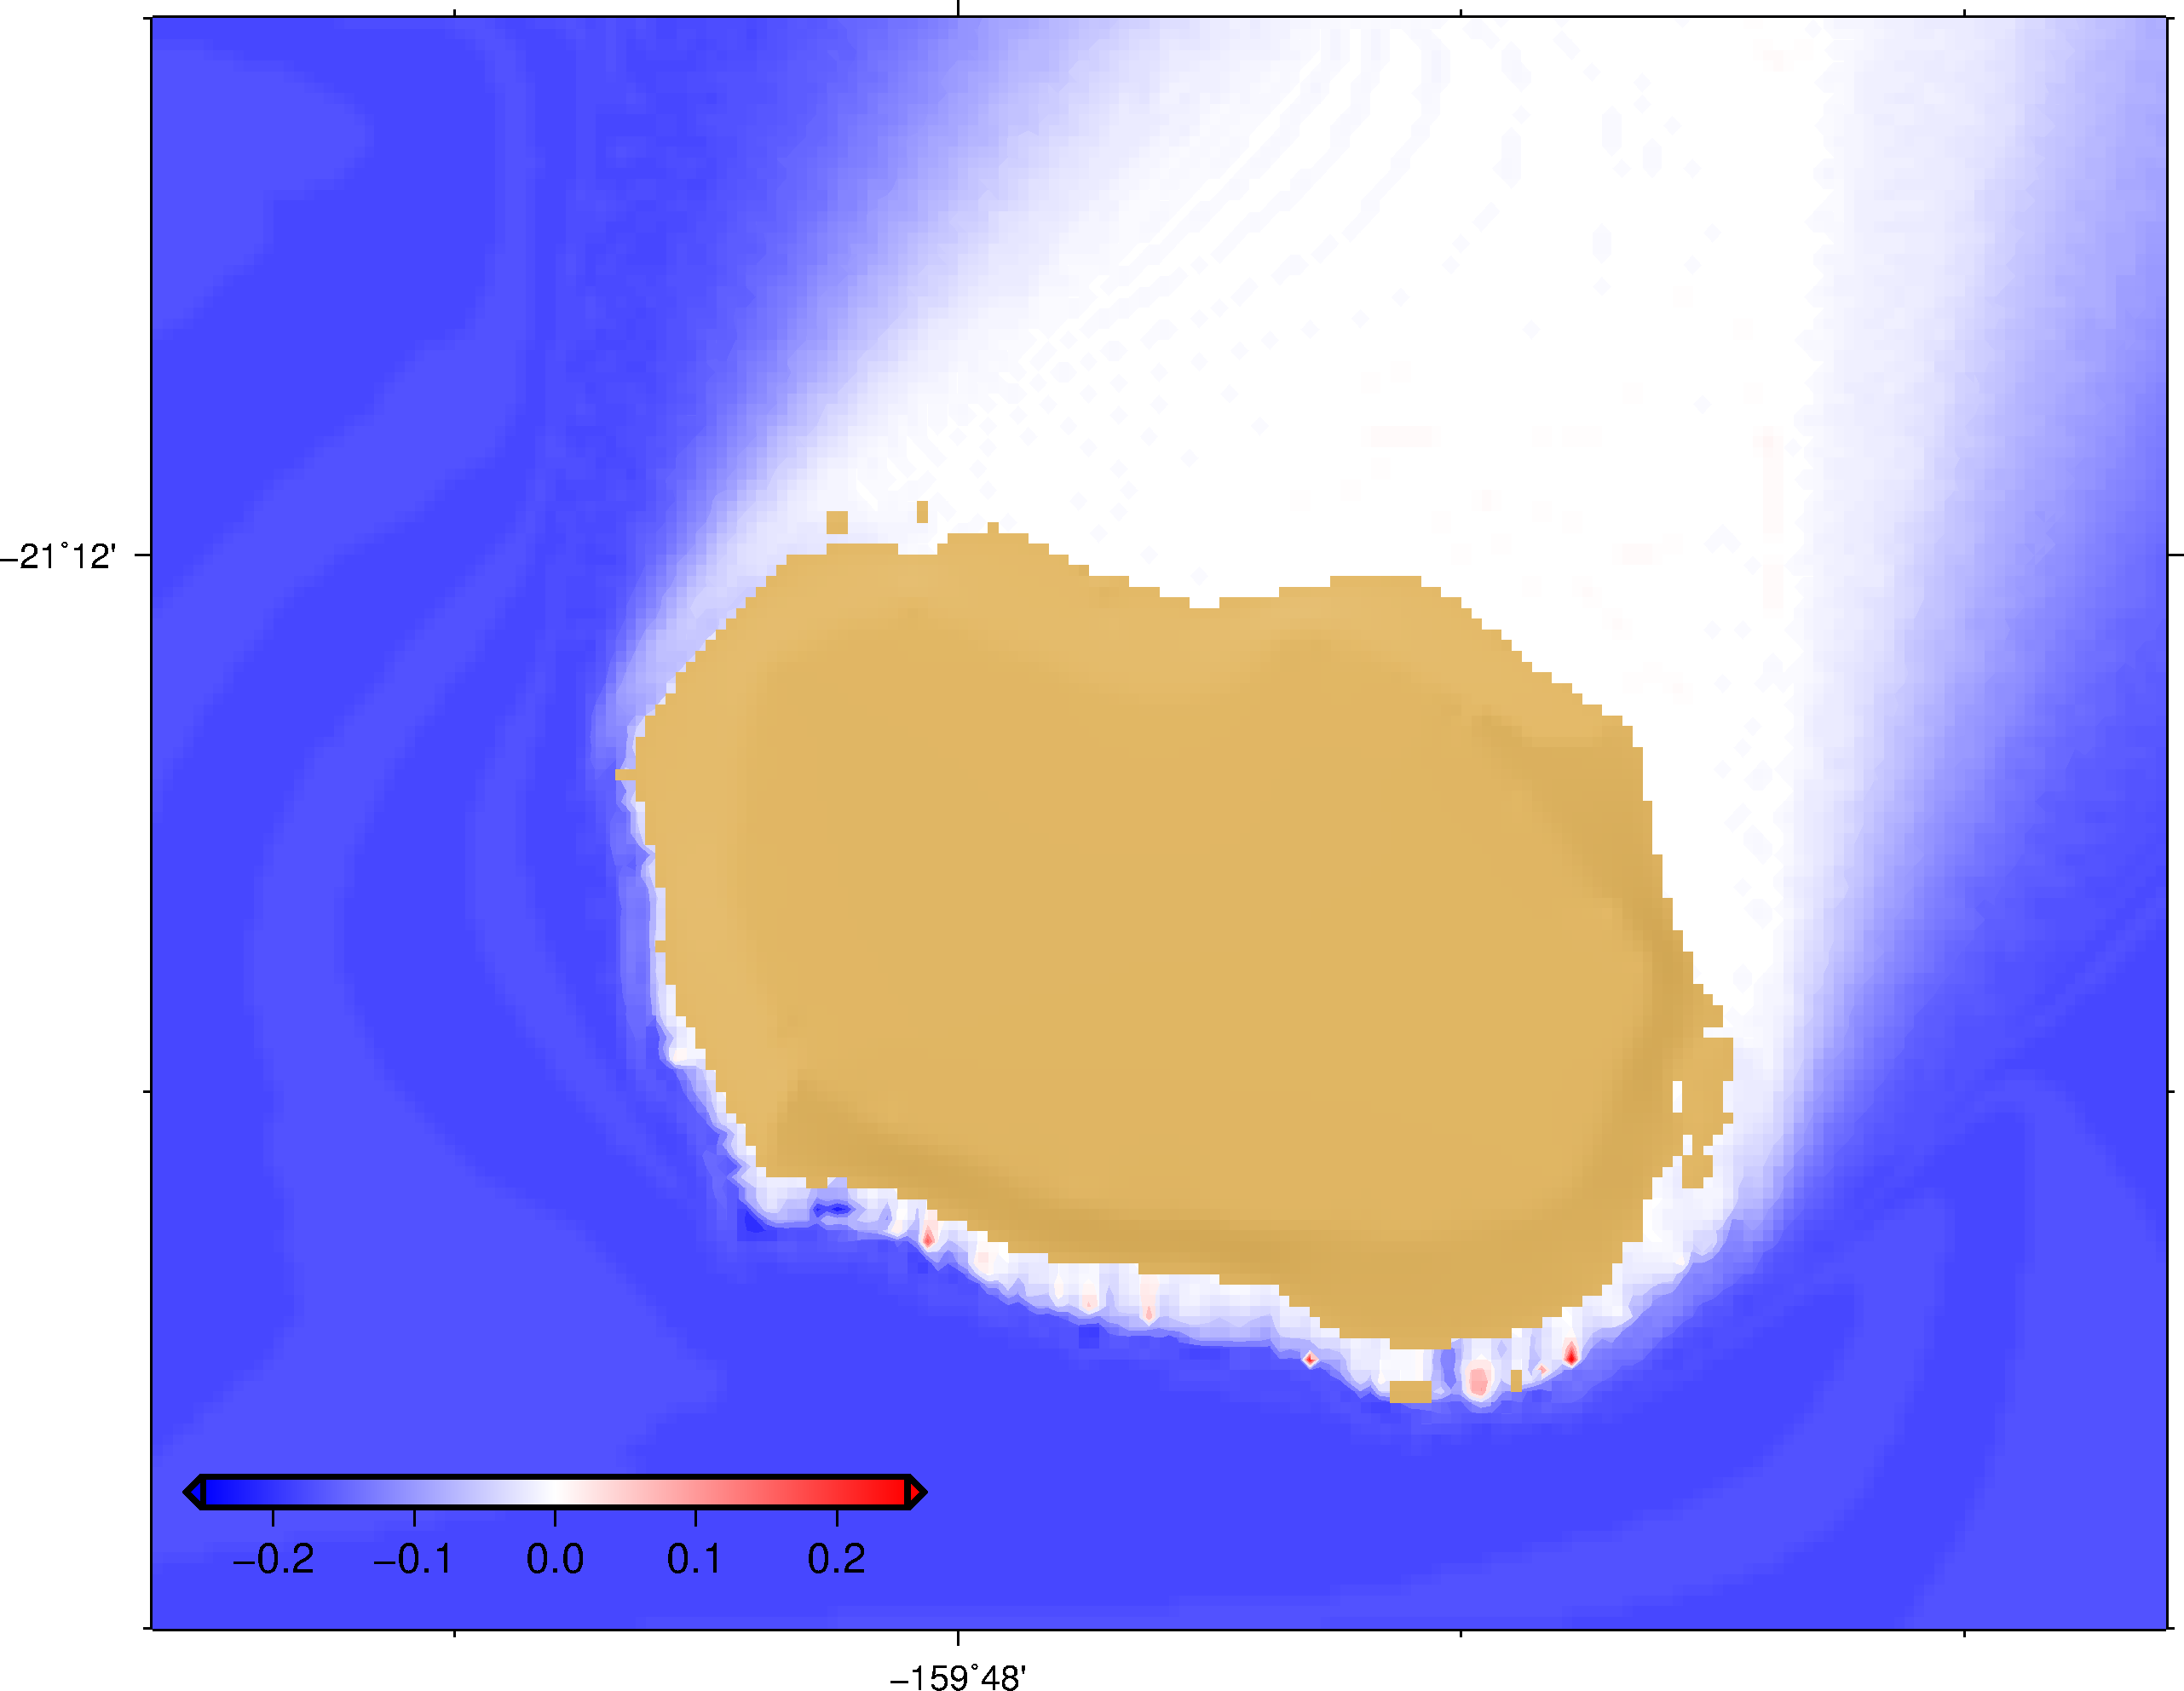
Mean Significant wave height (Hs) changes END21C RCP4.5
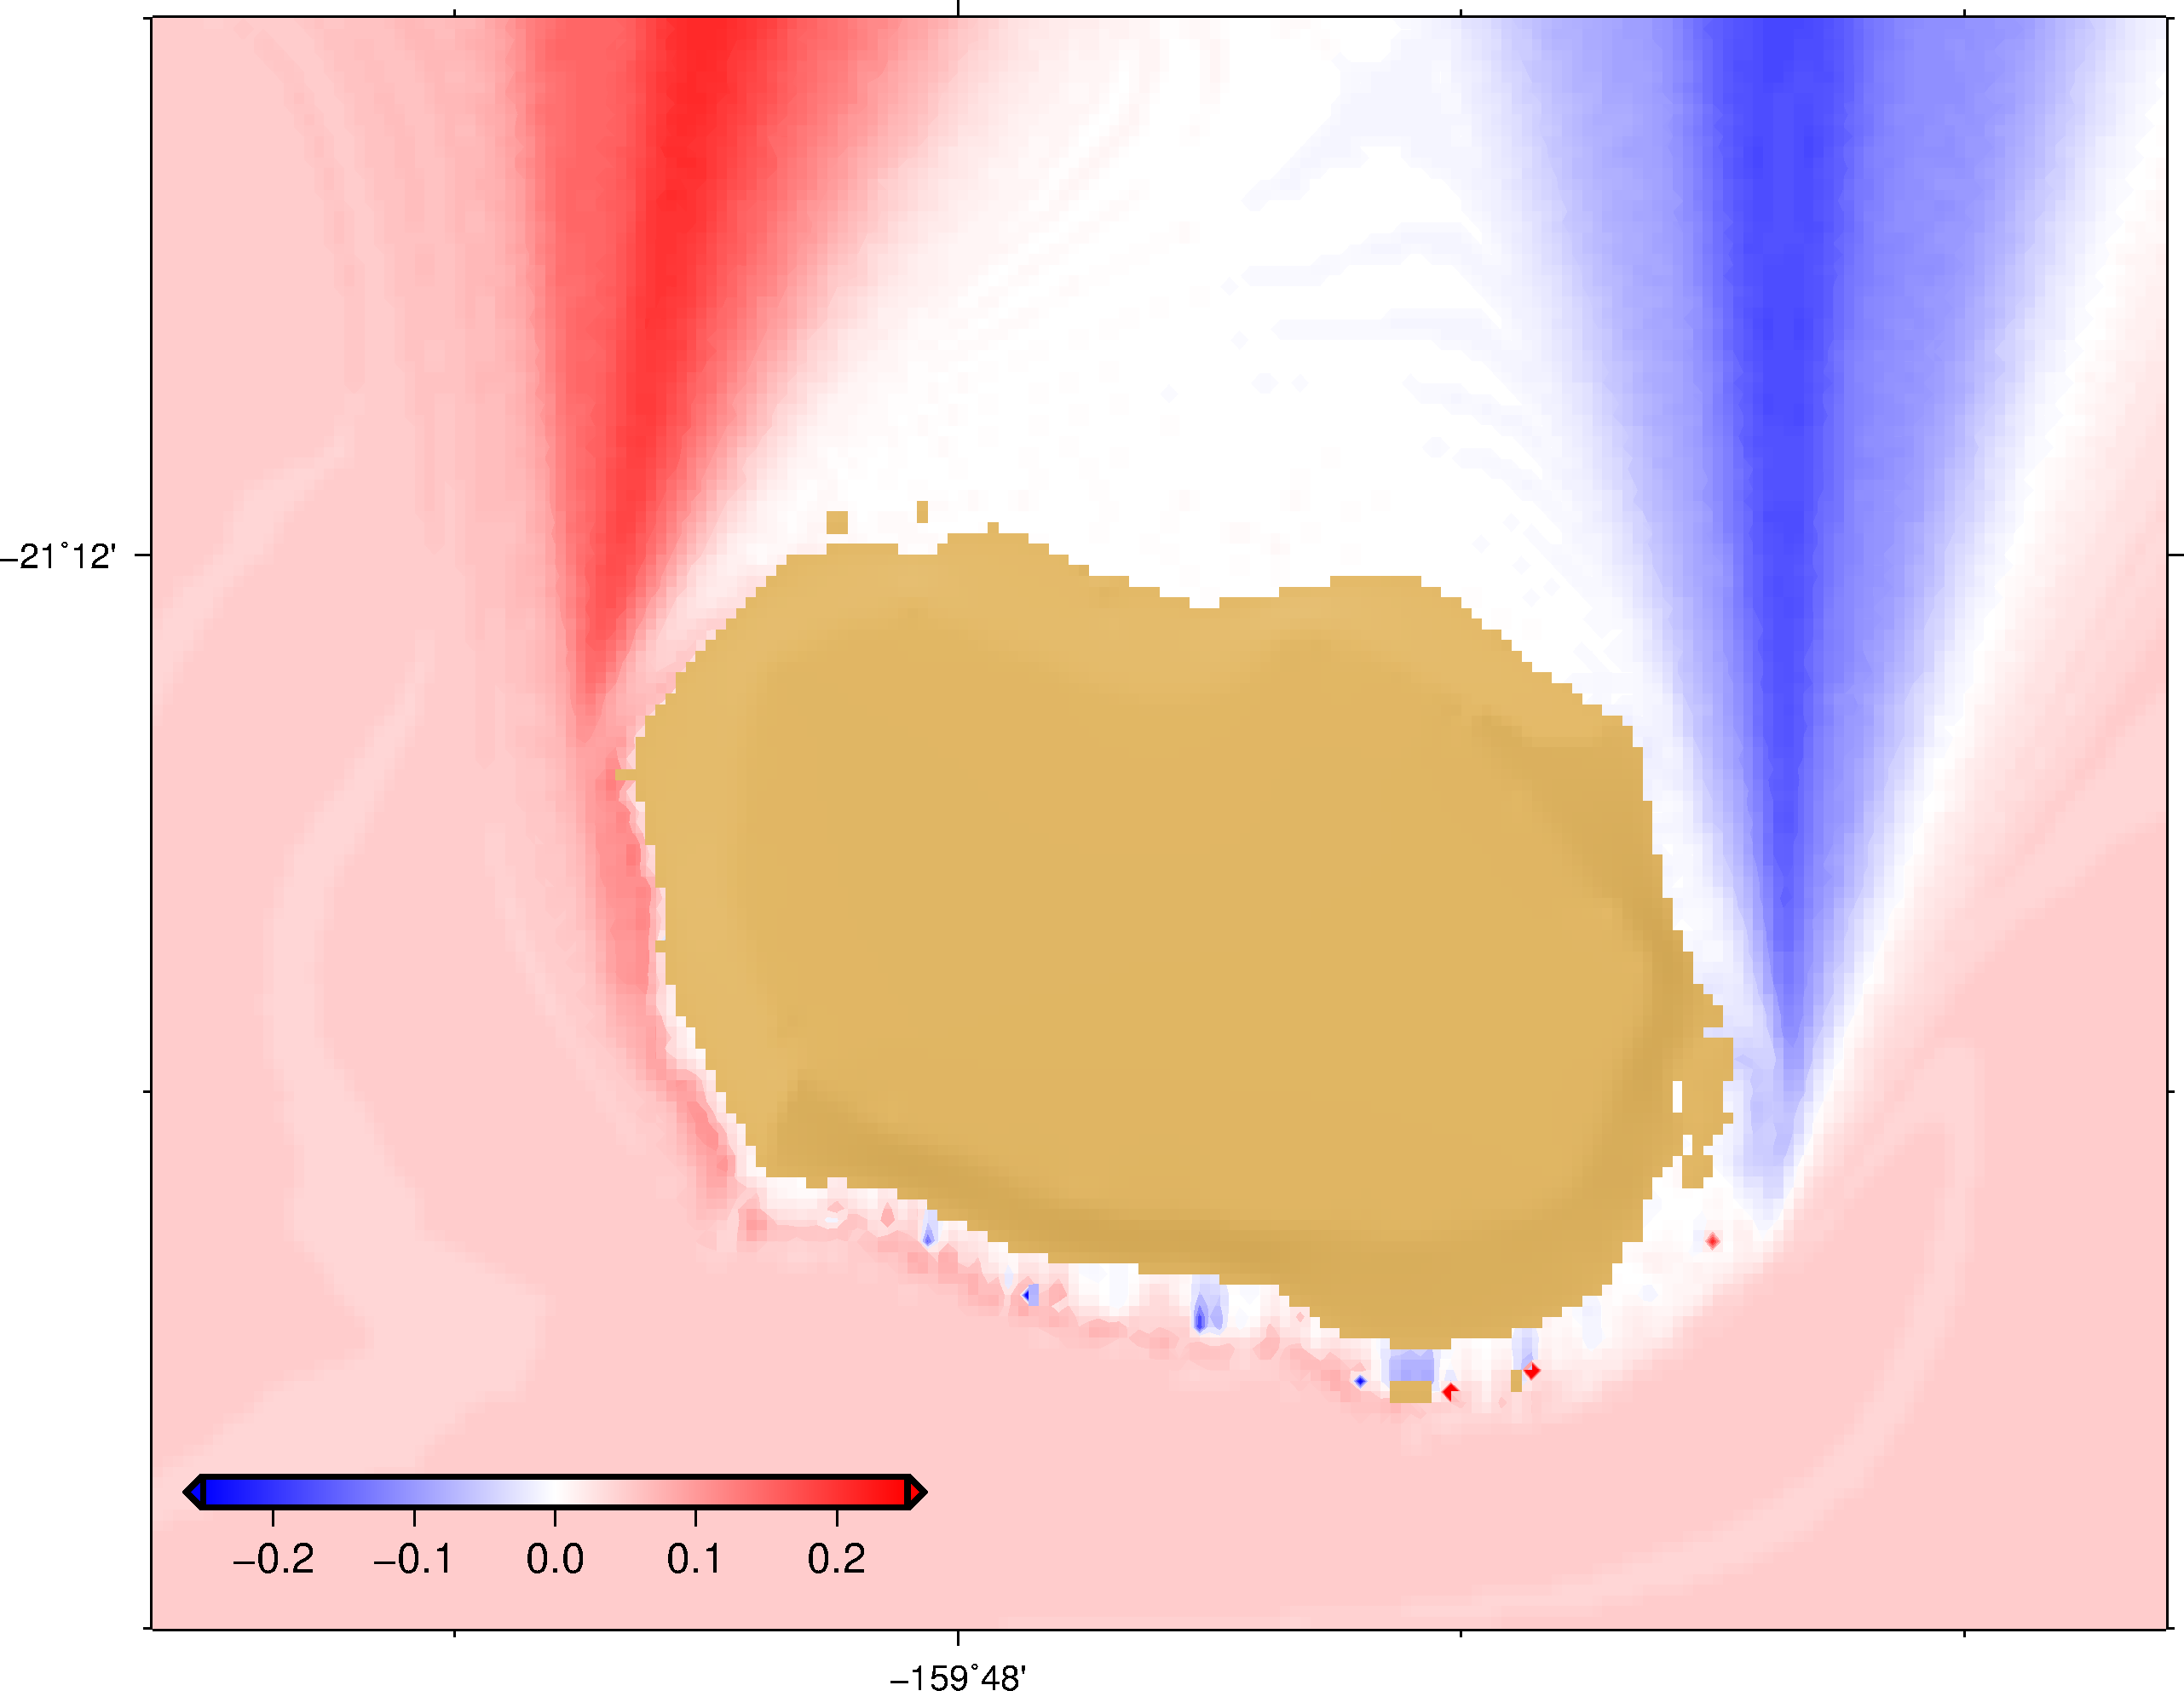
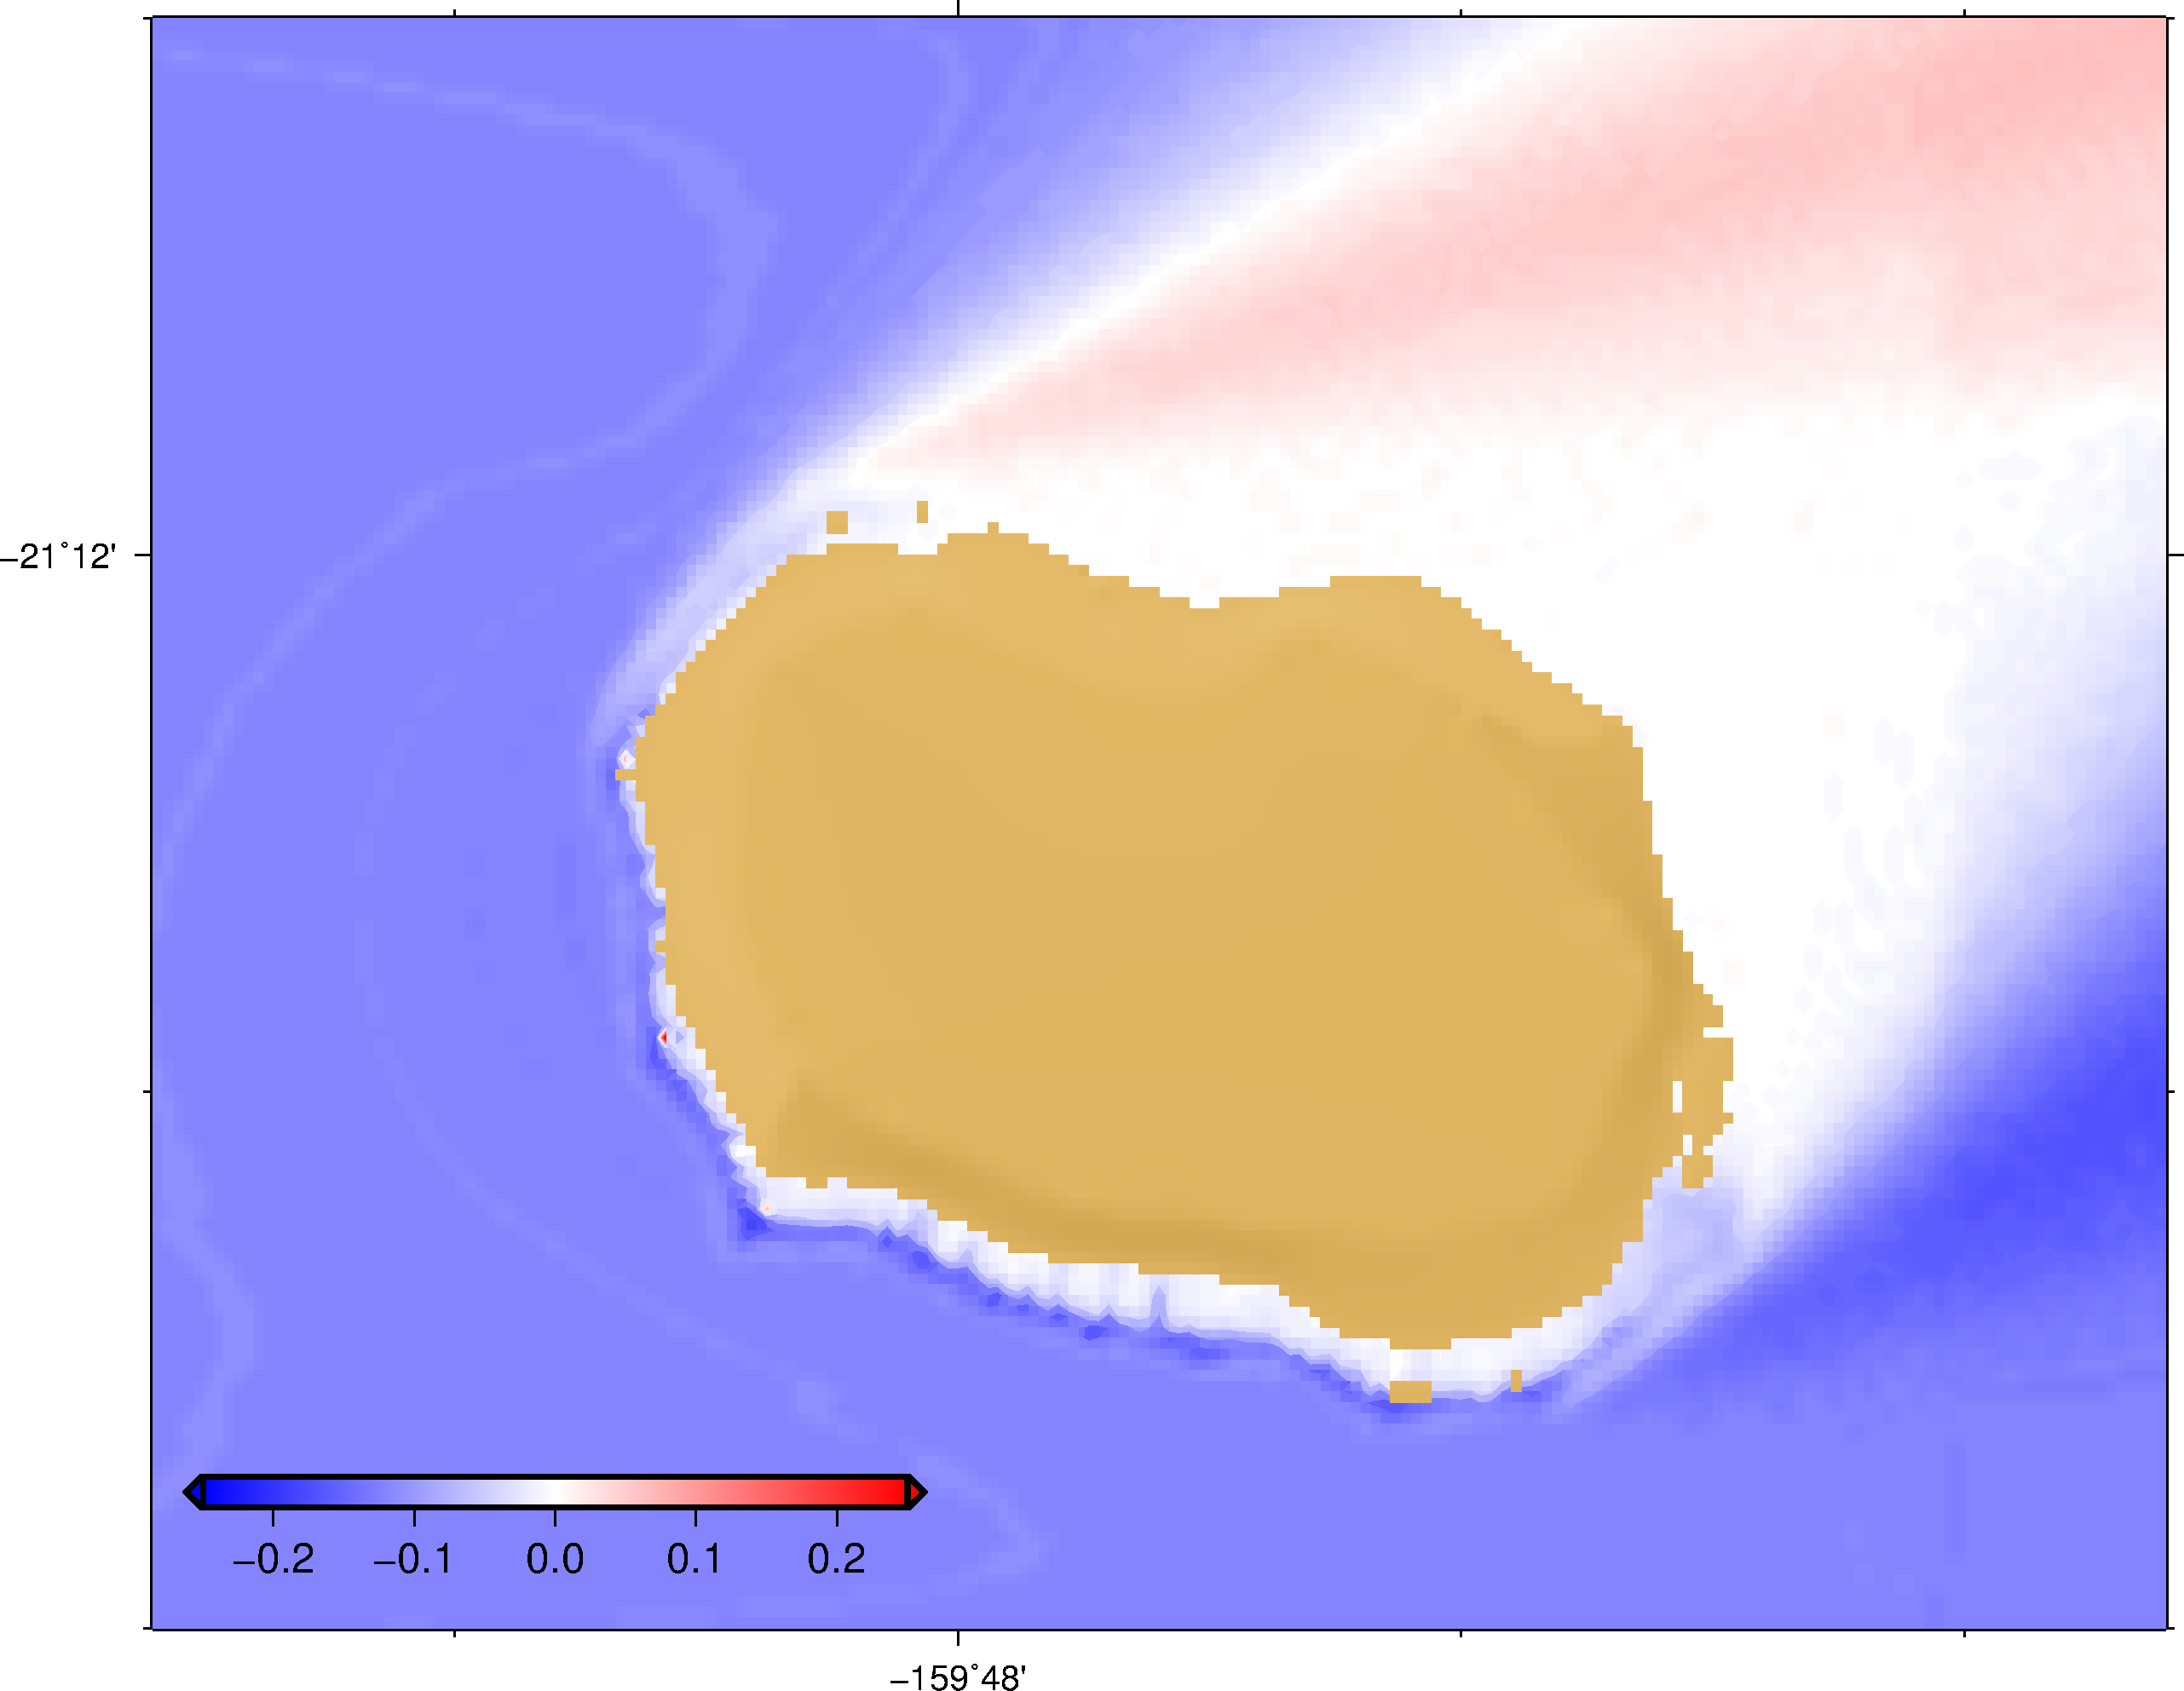
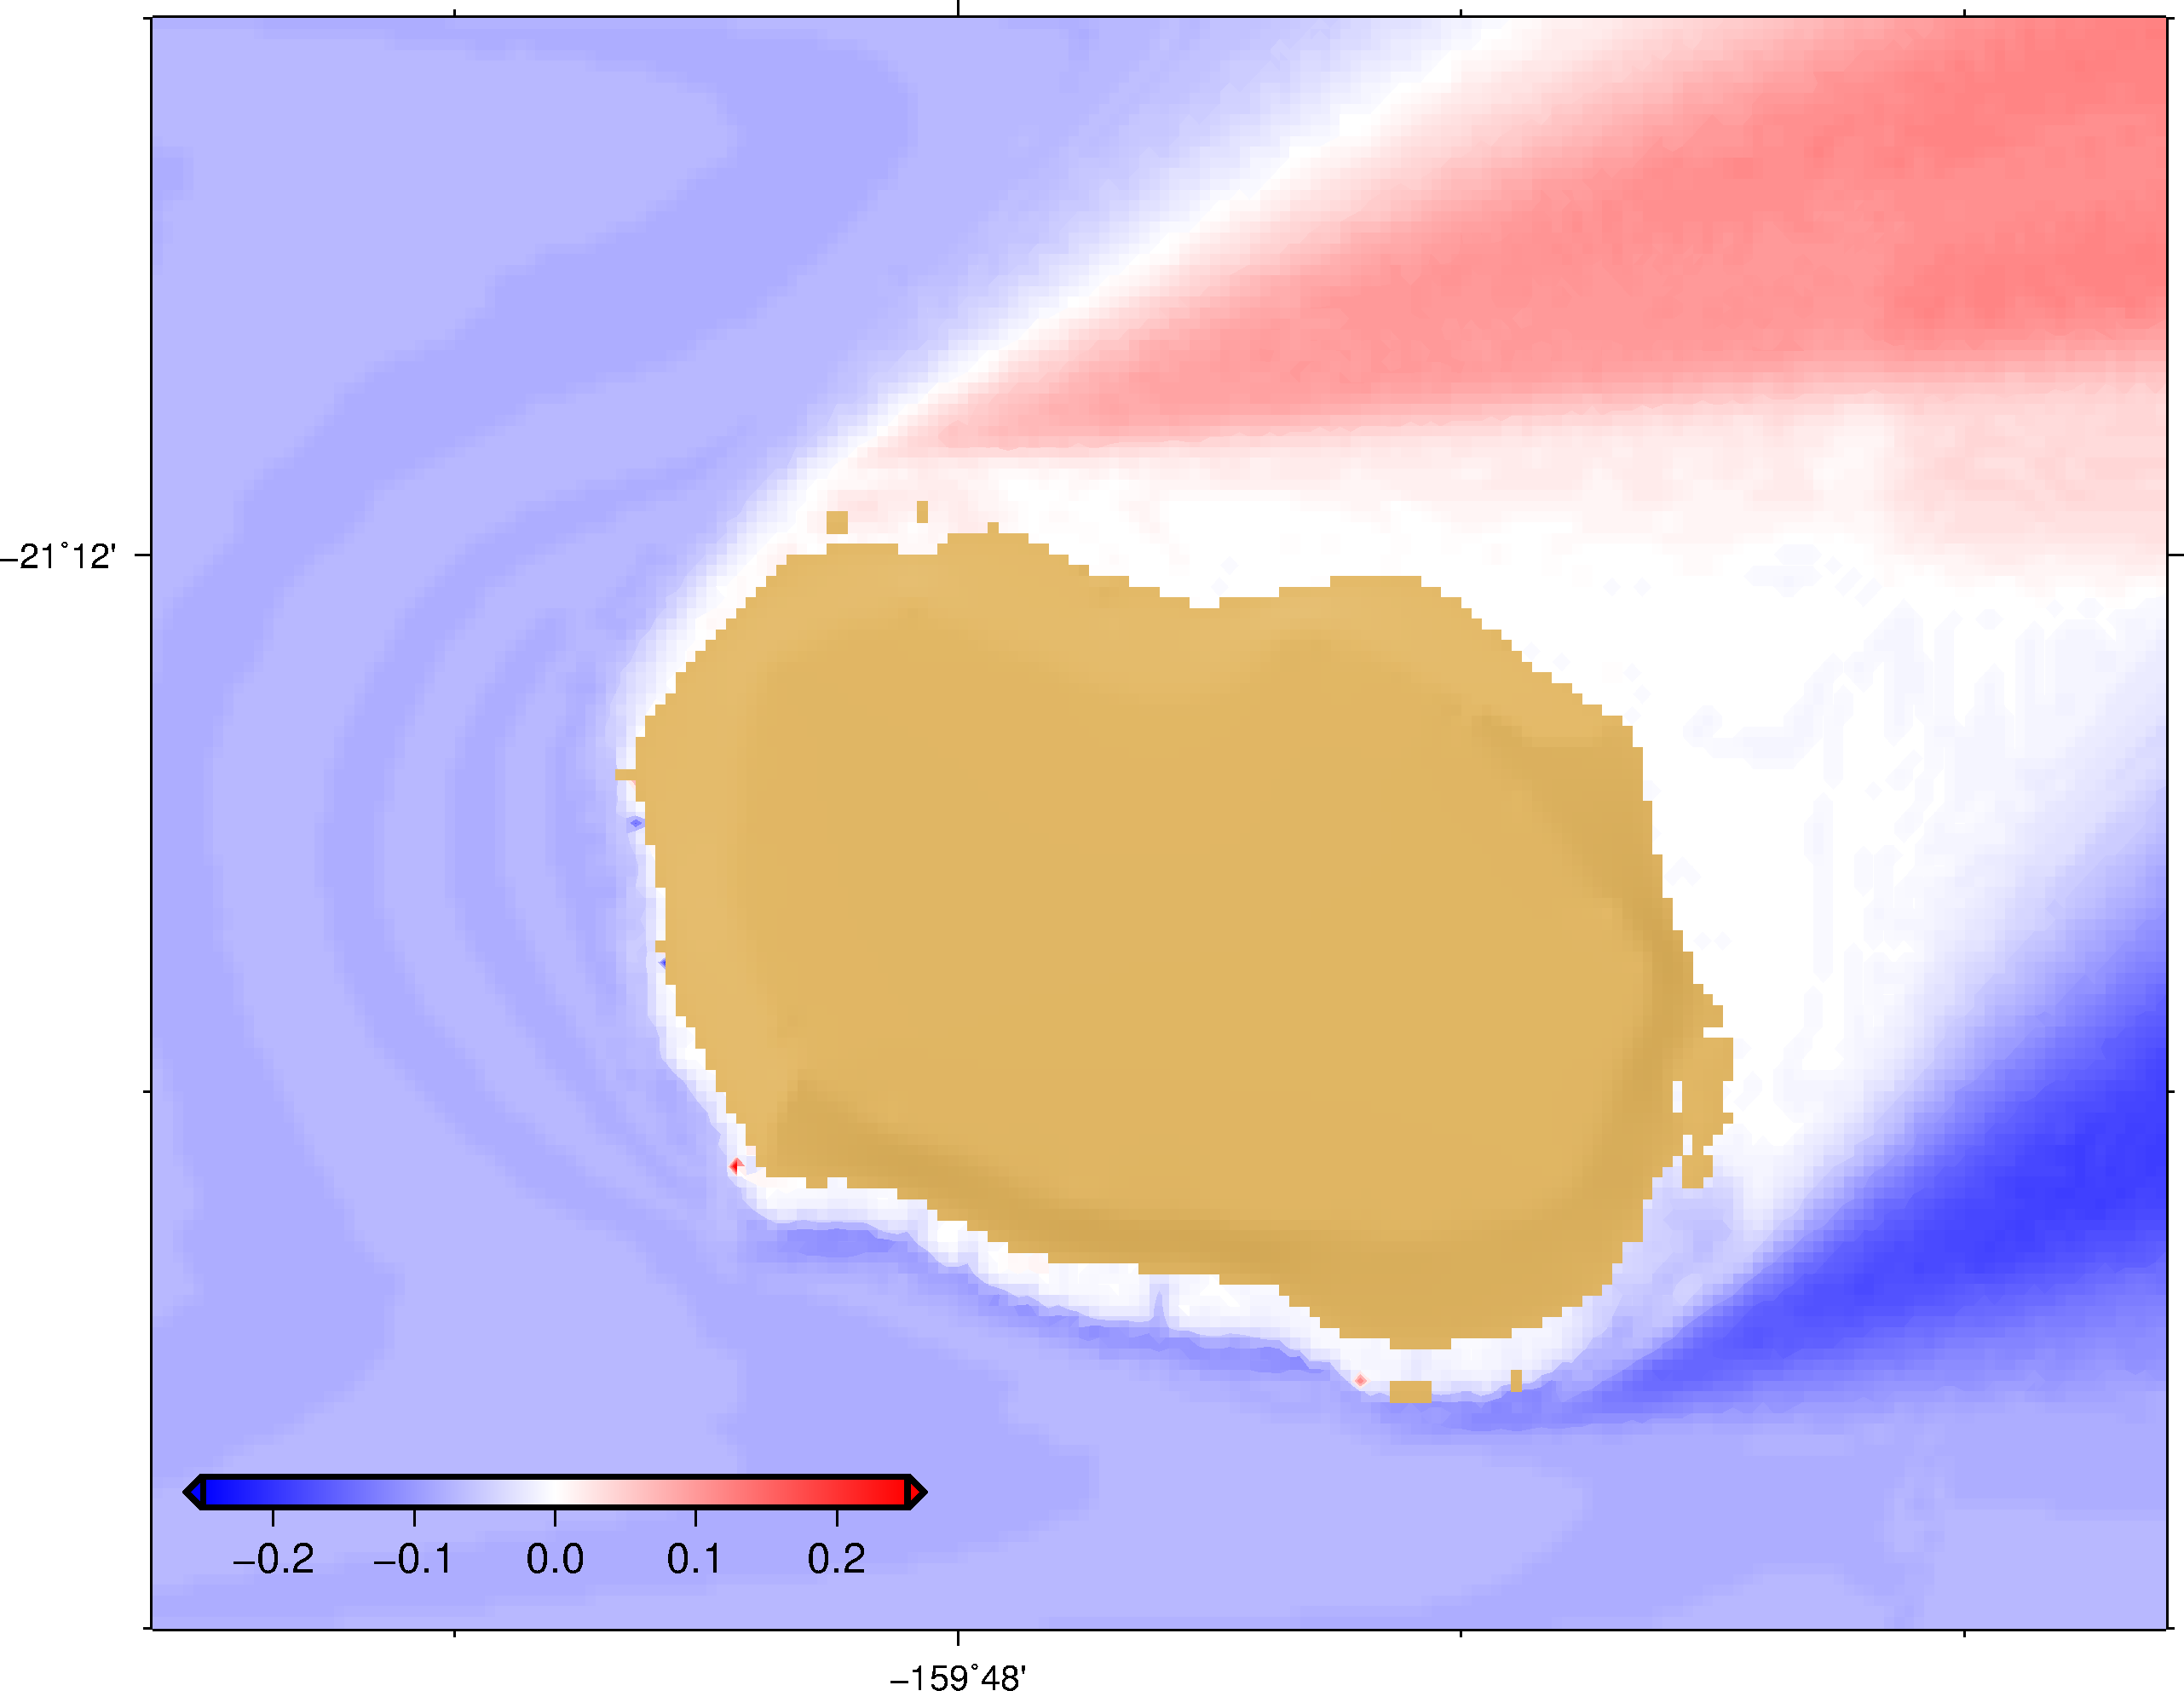
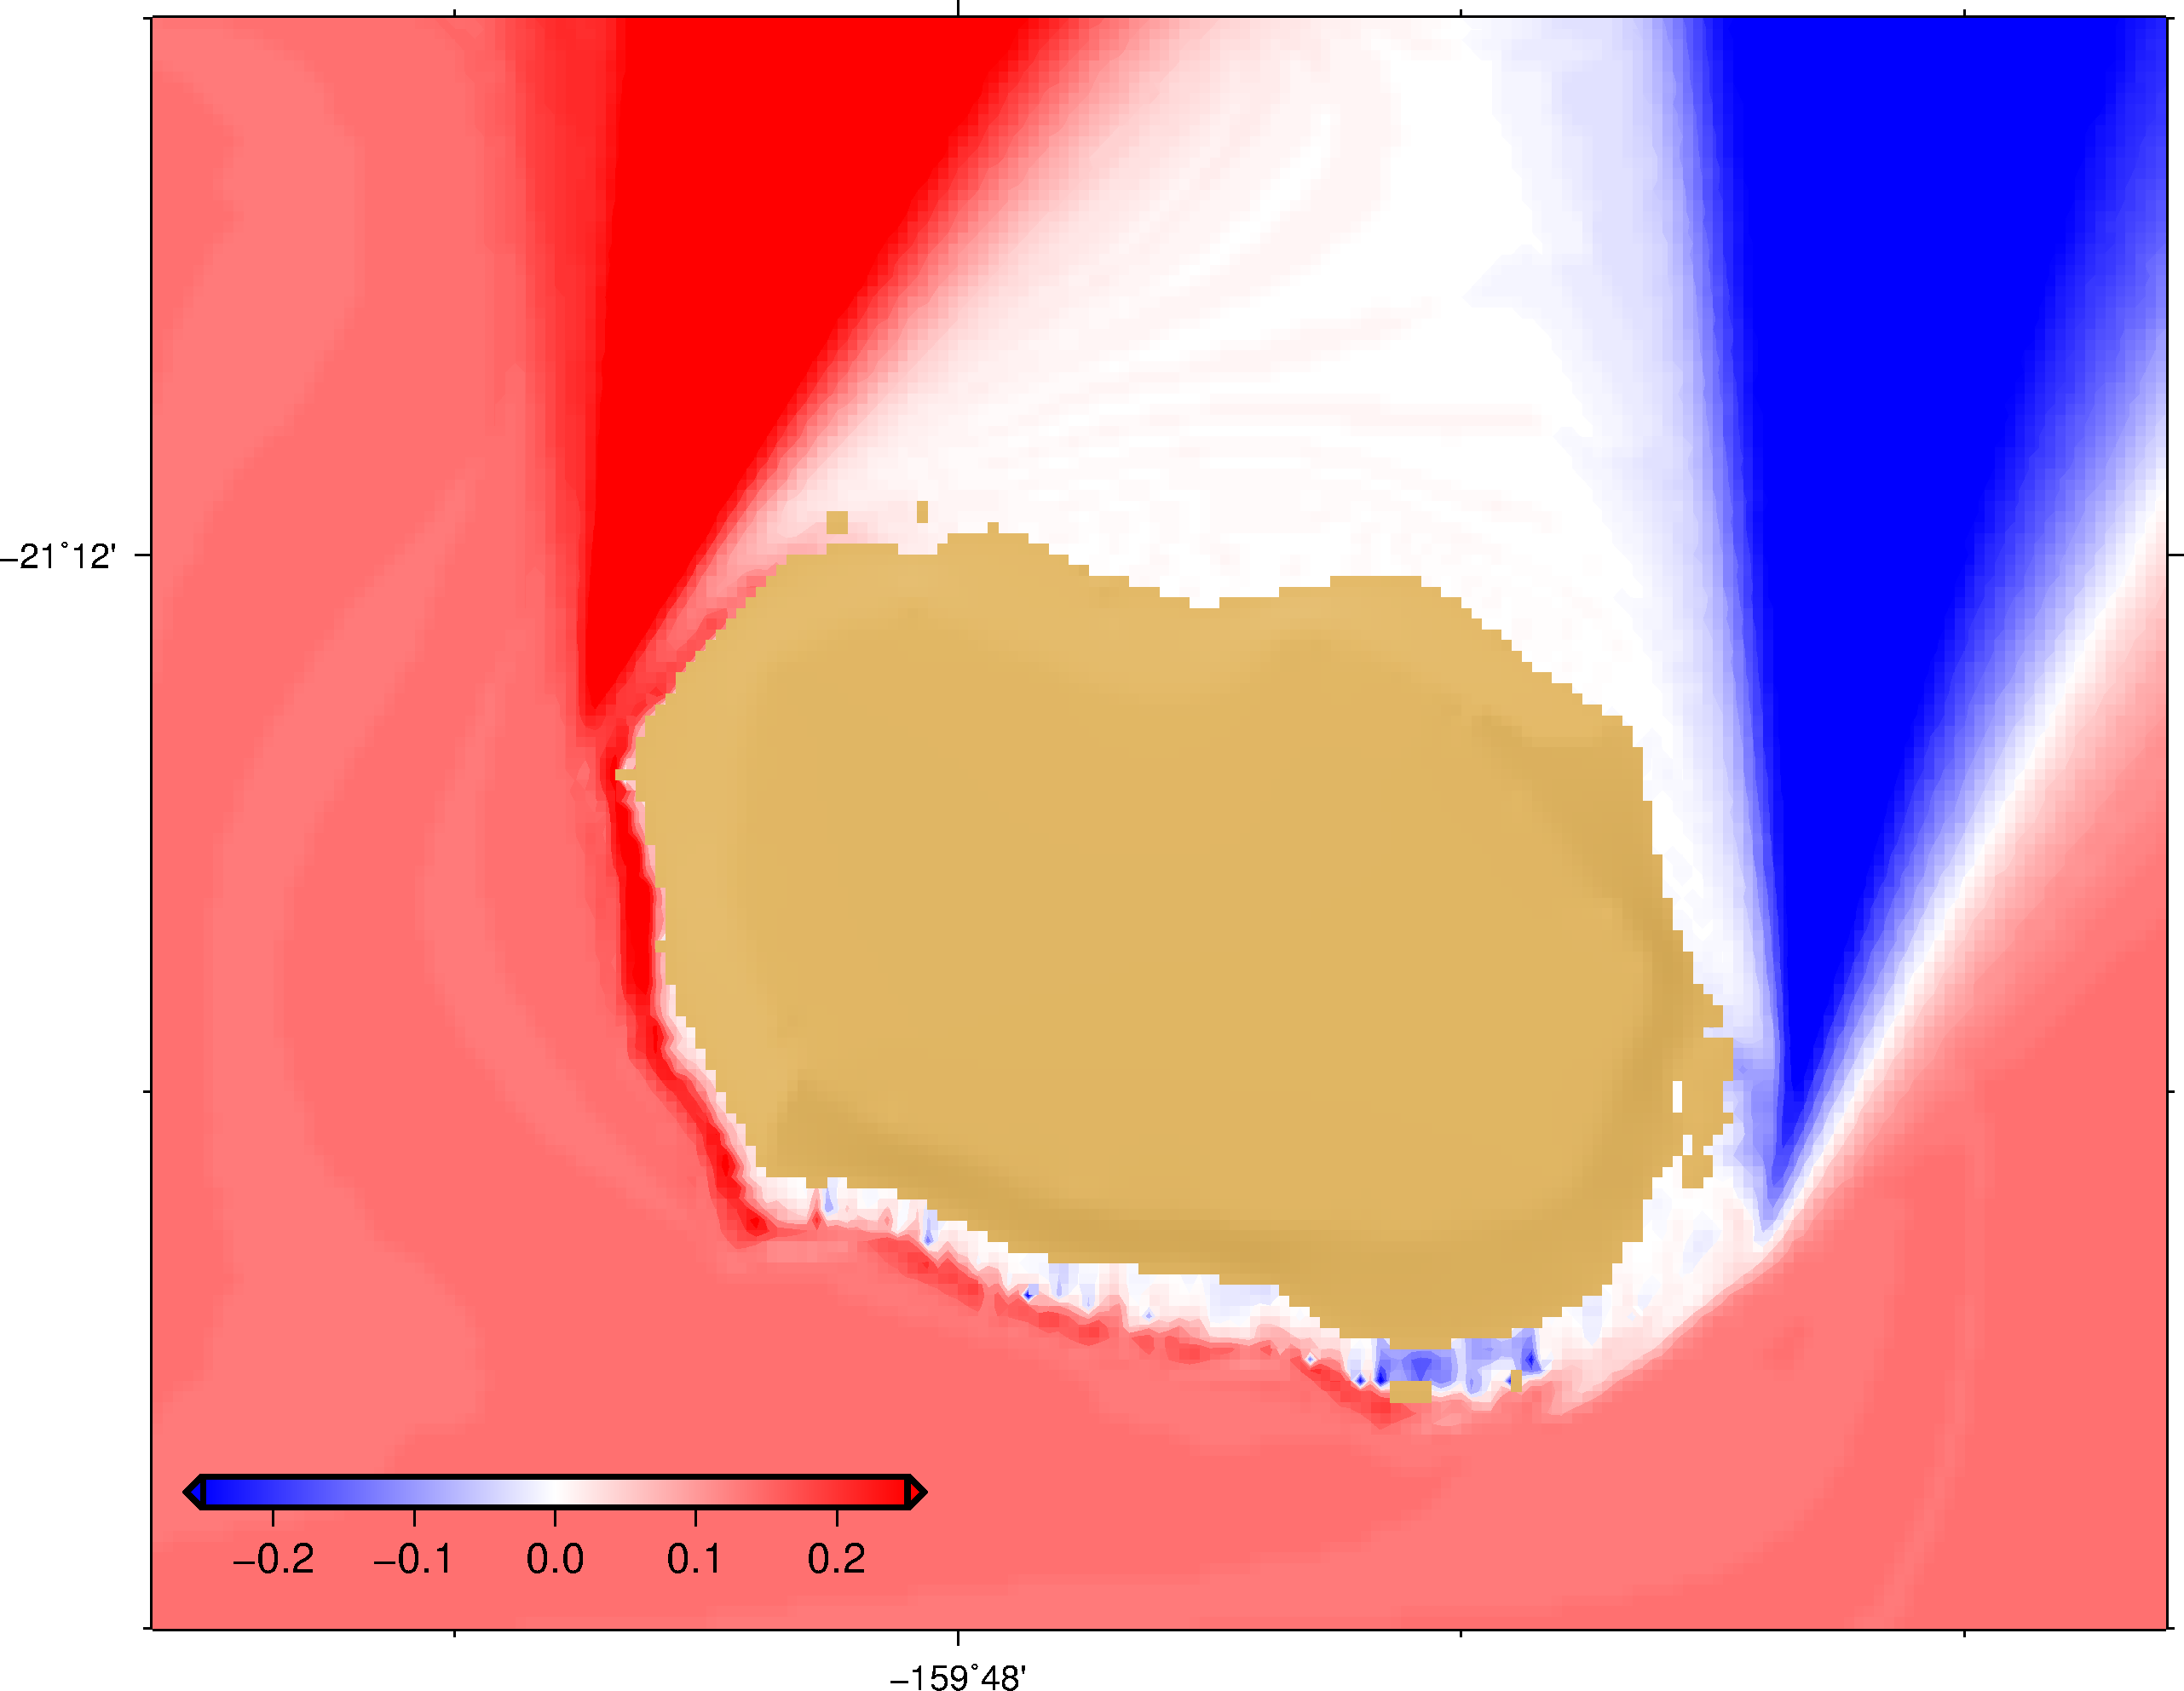
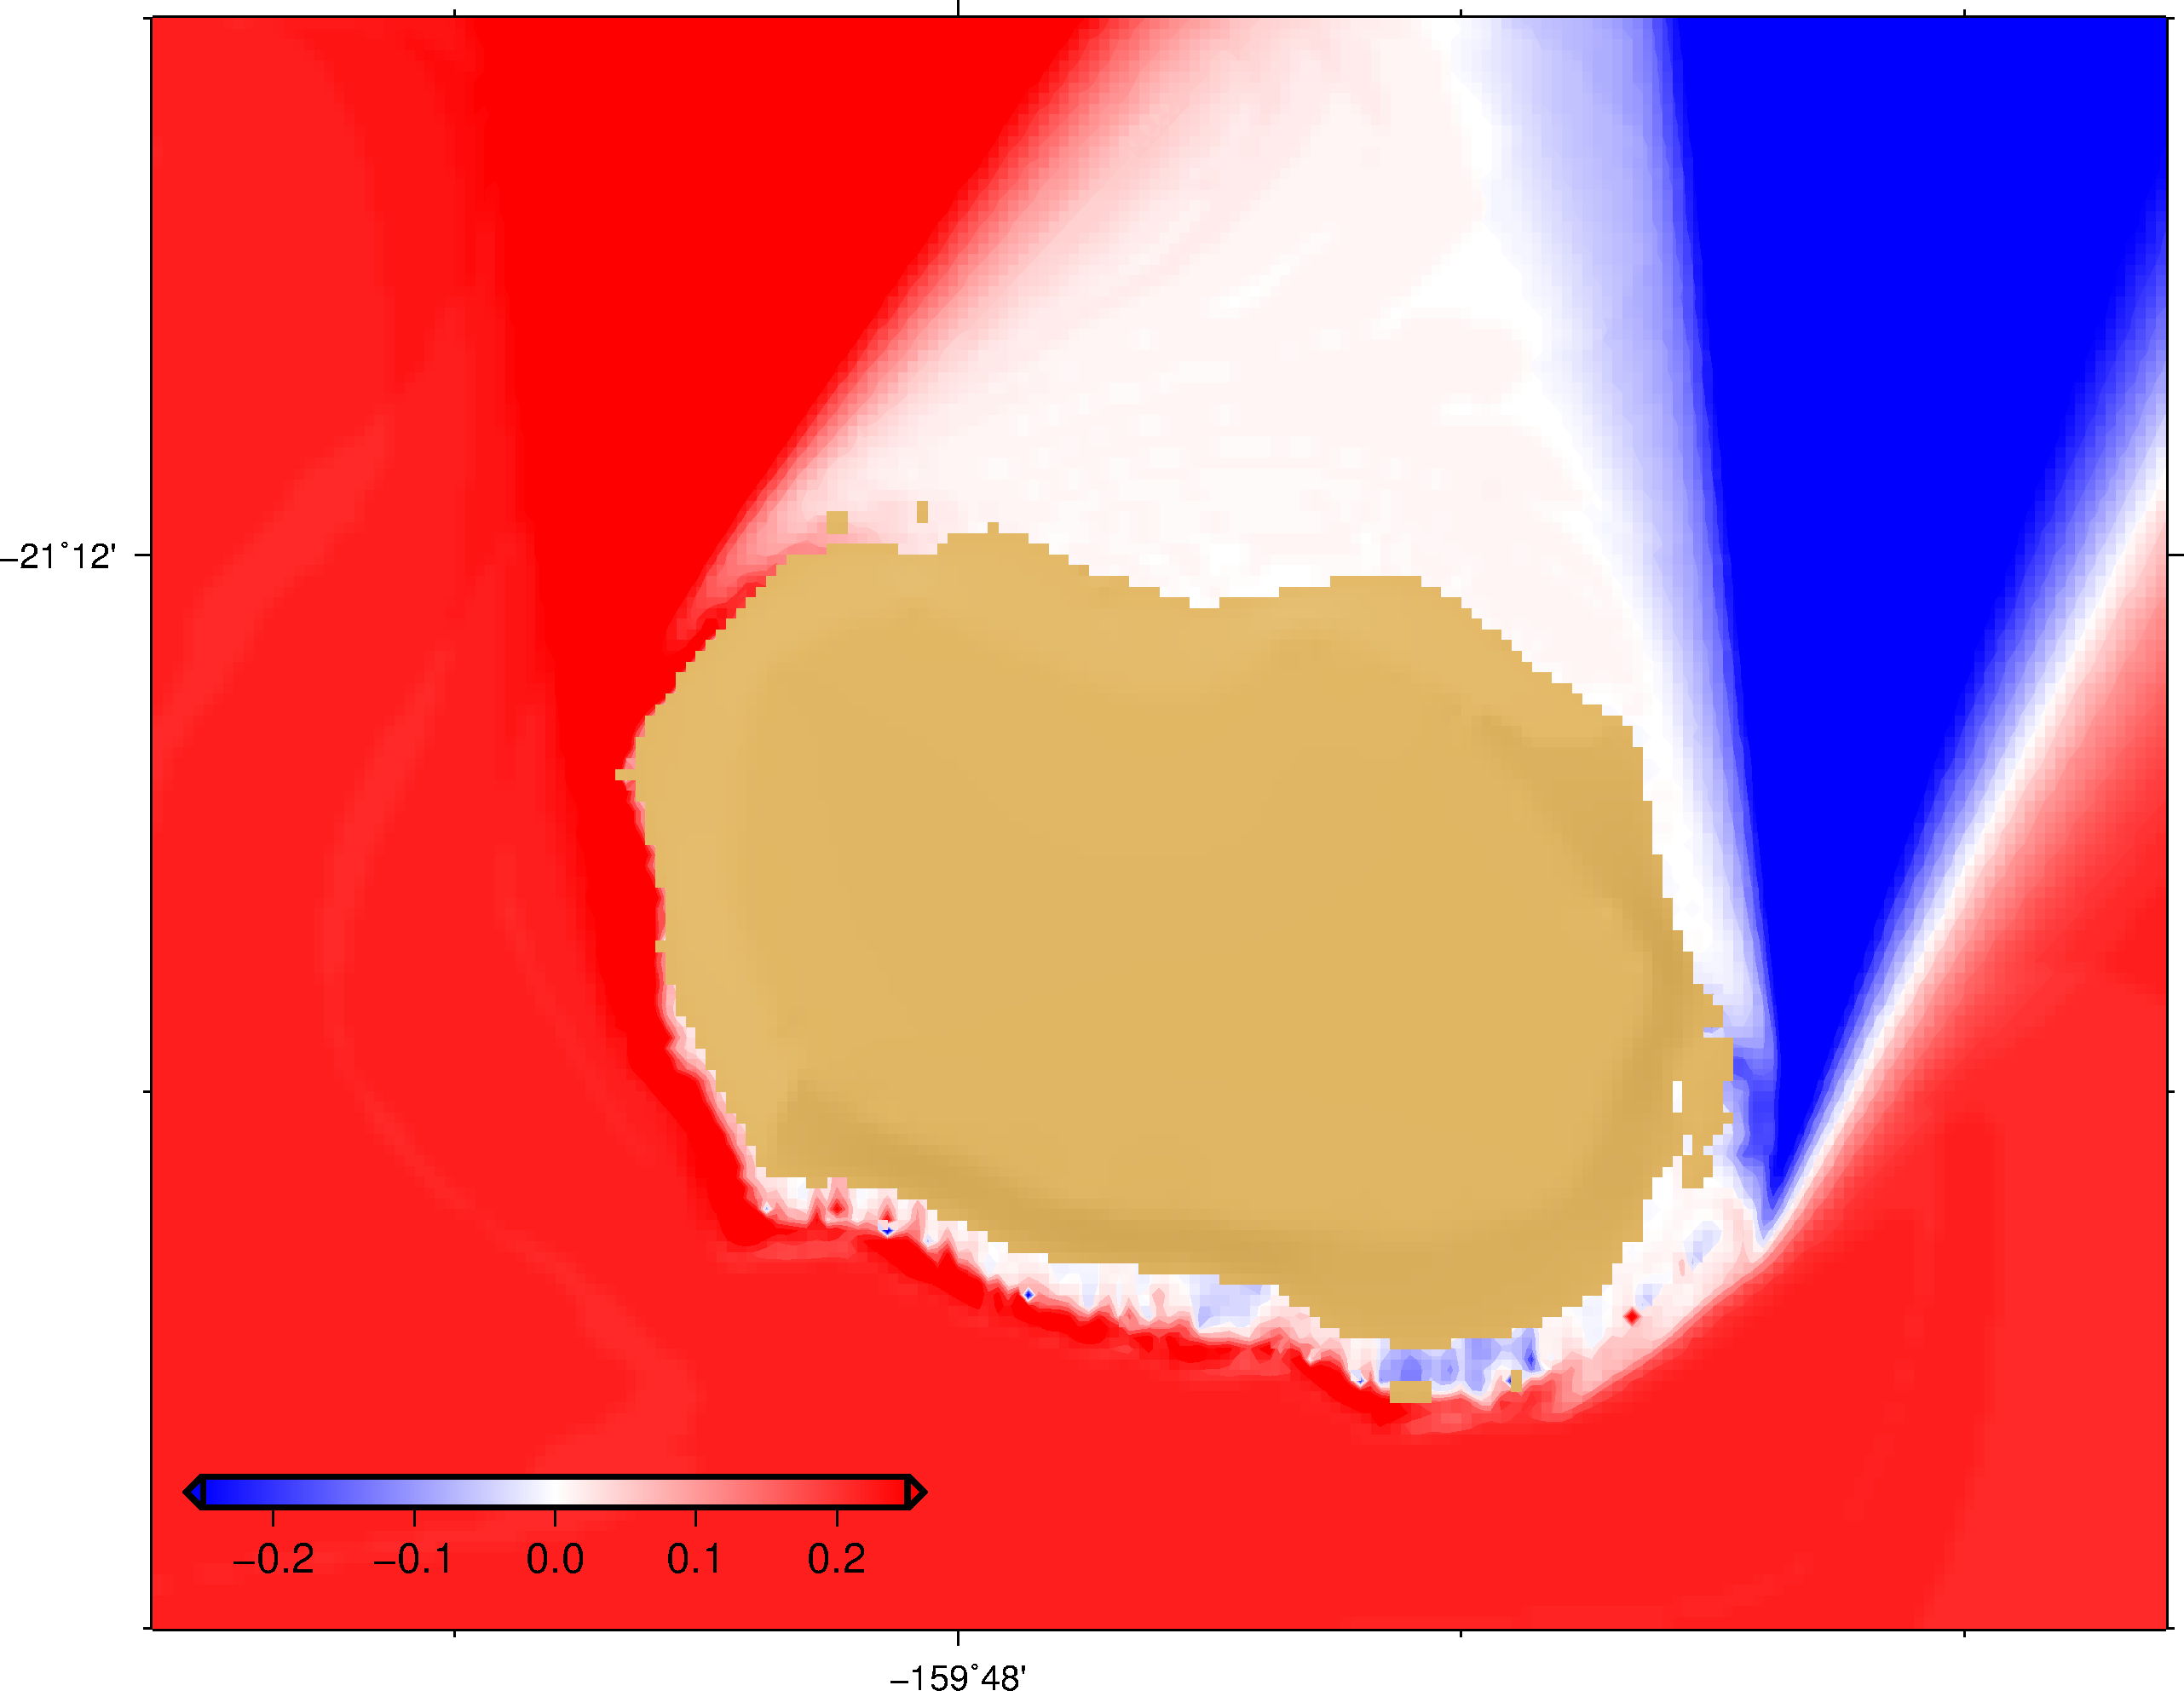
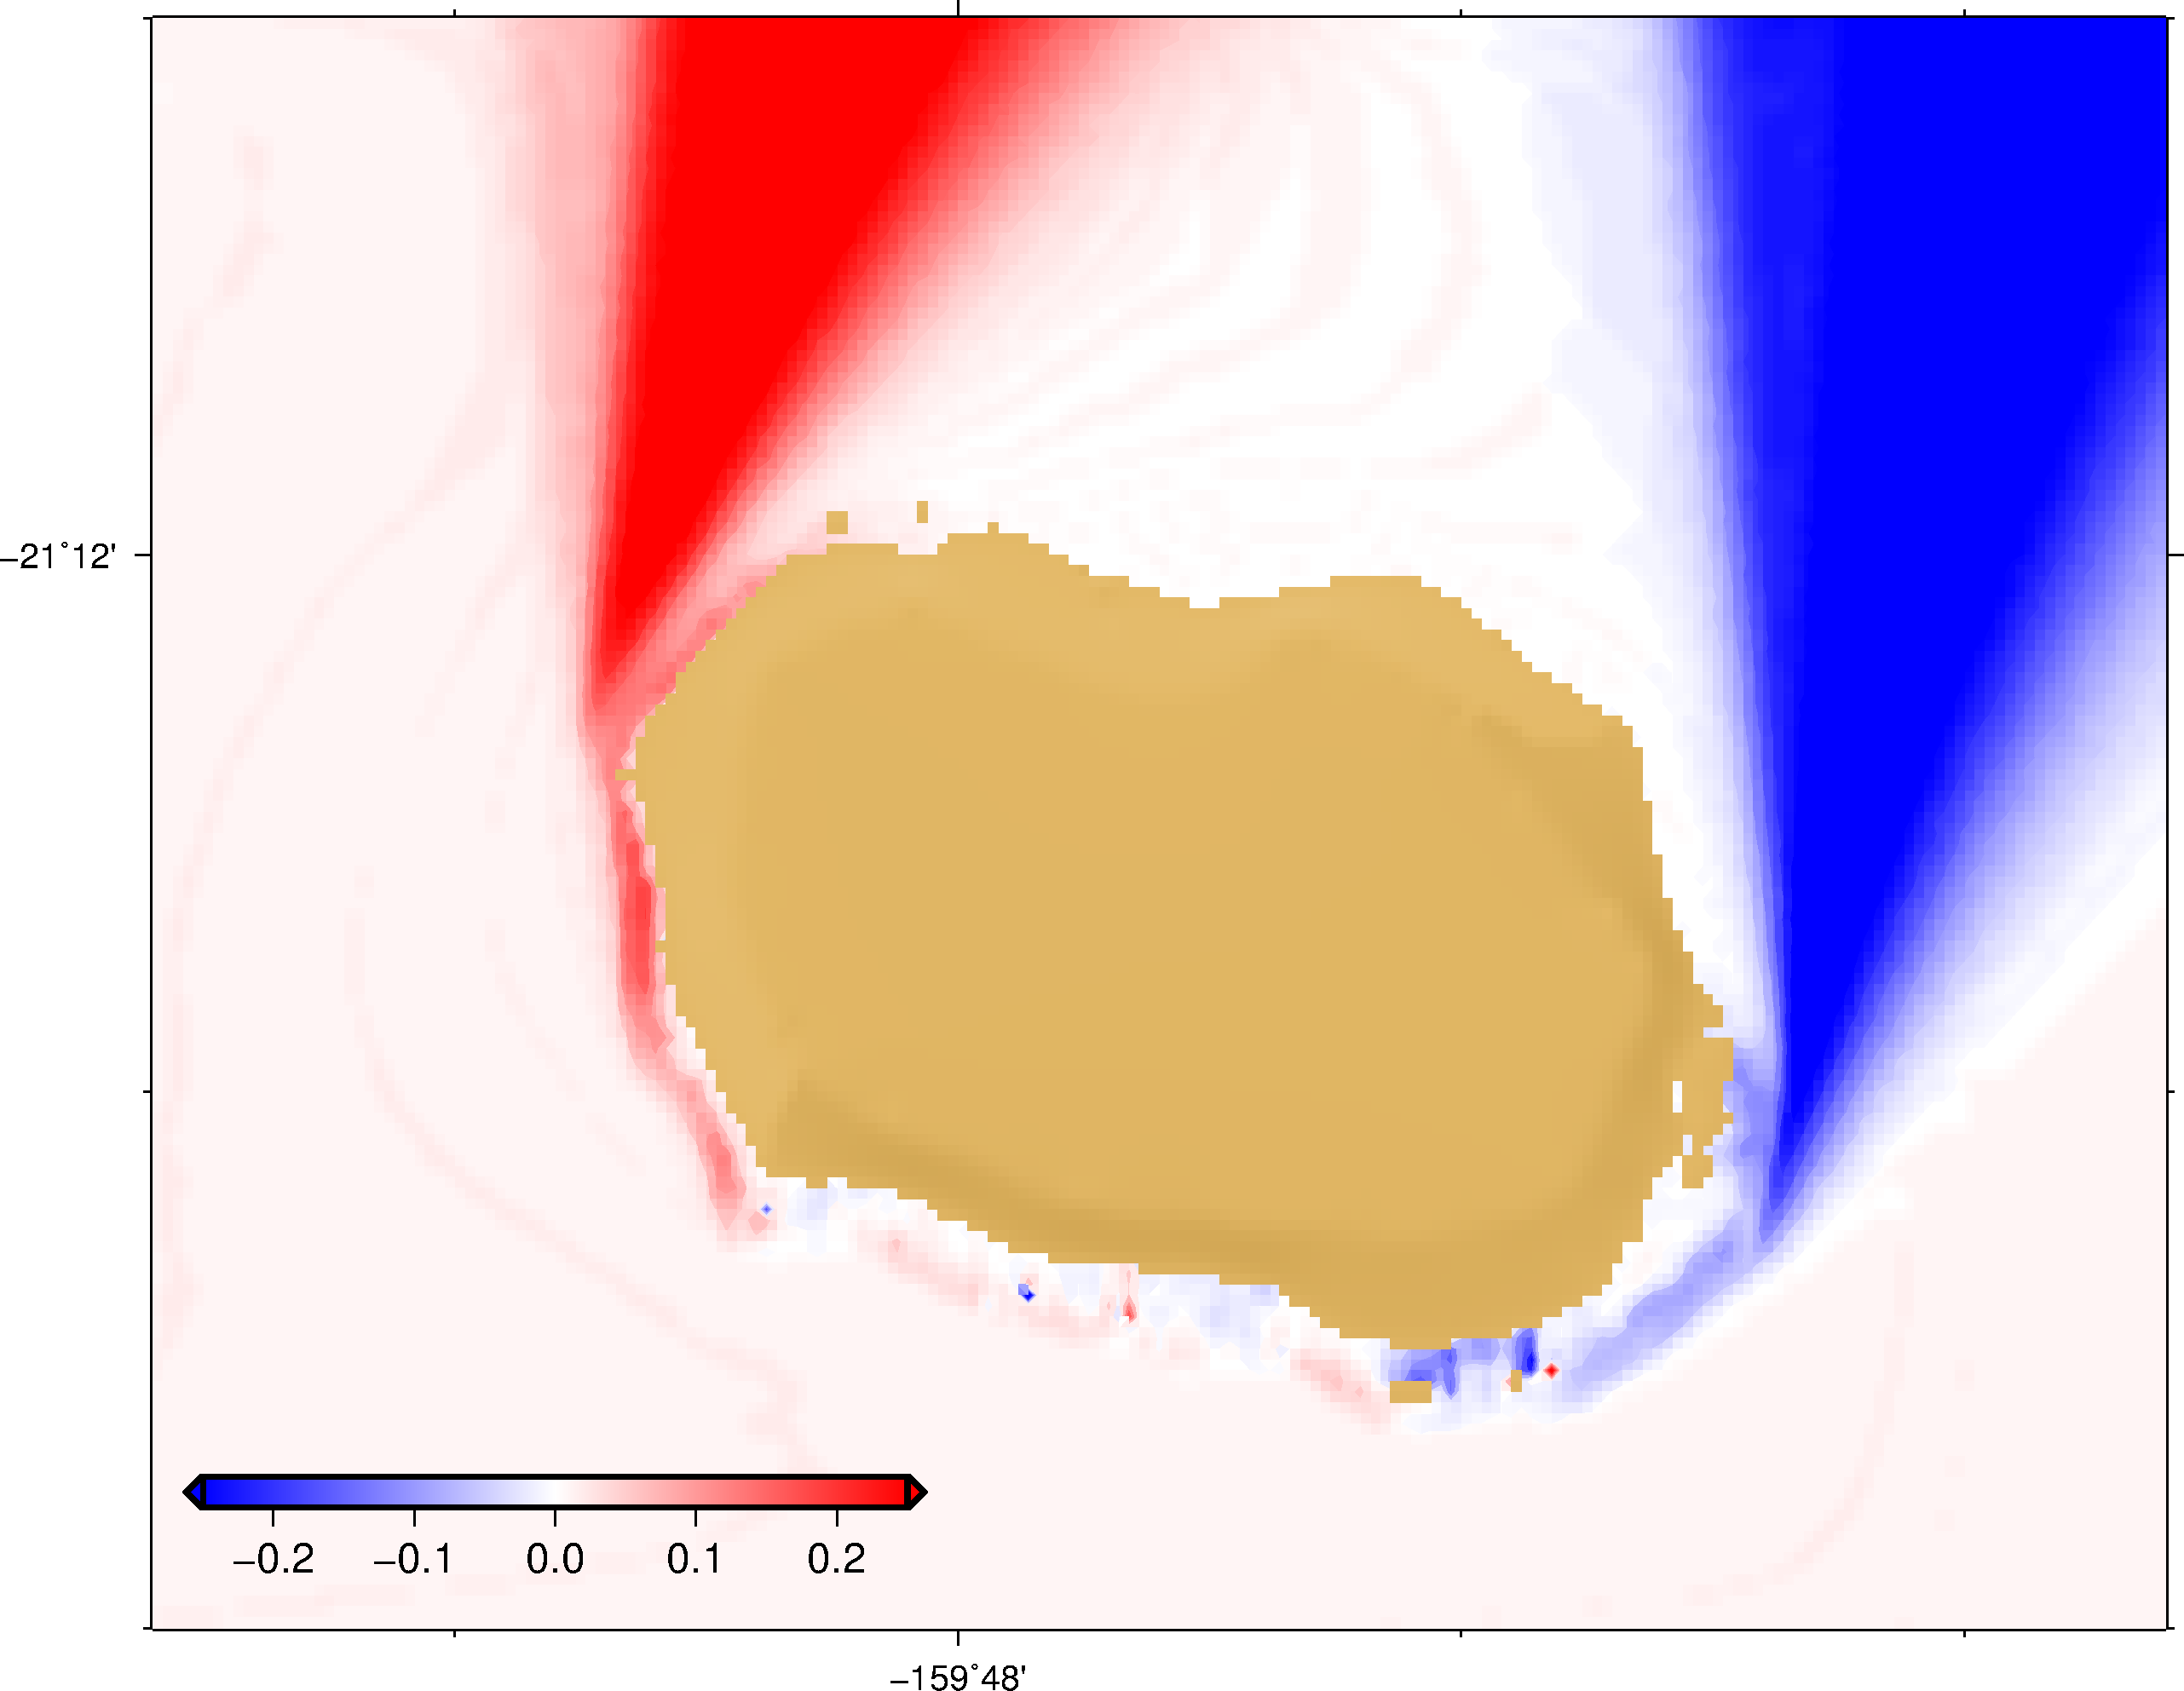
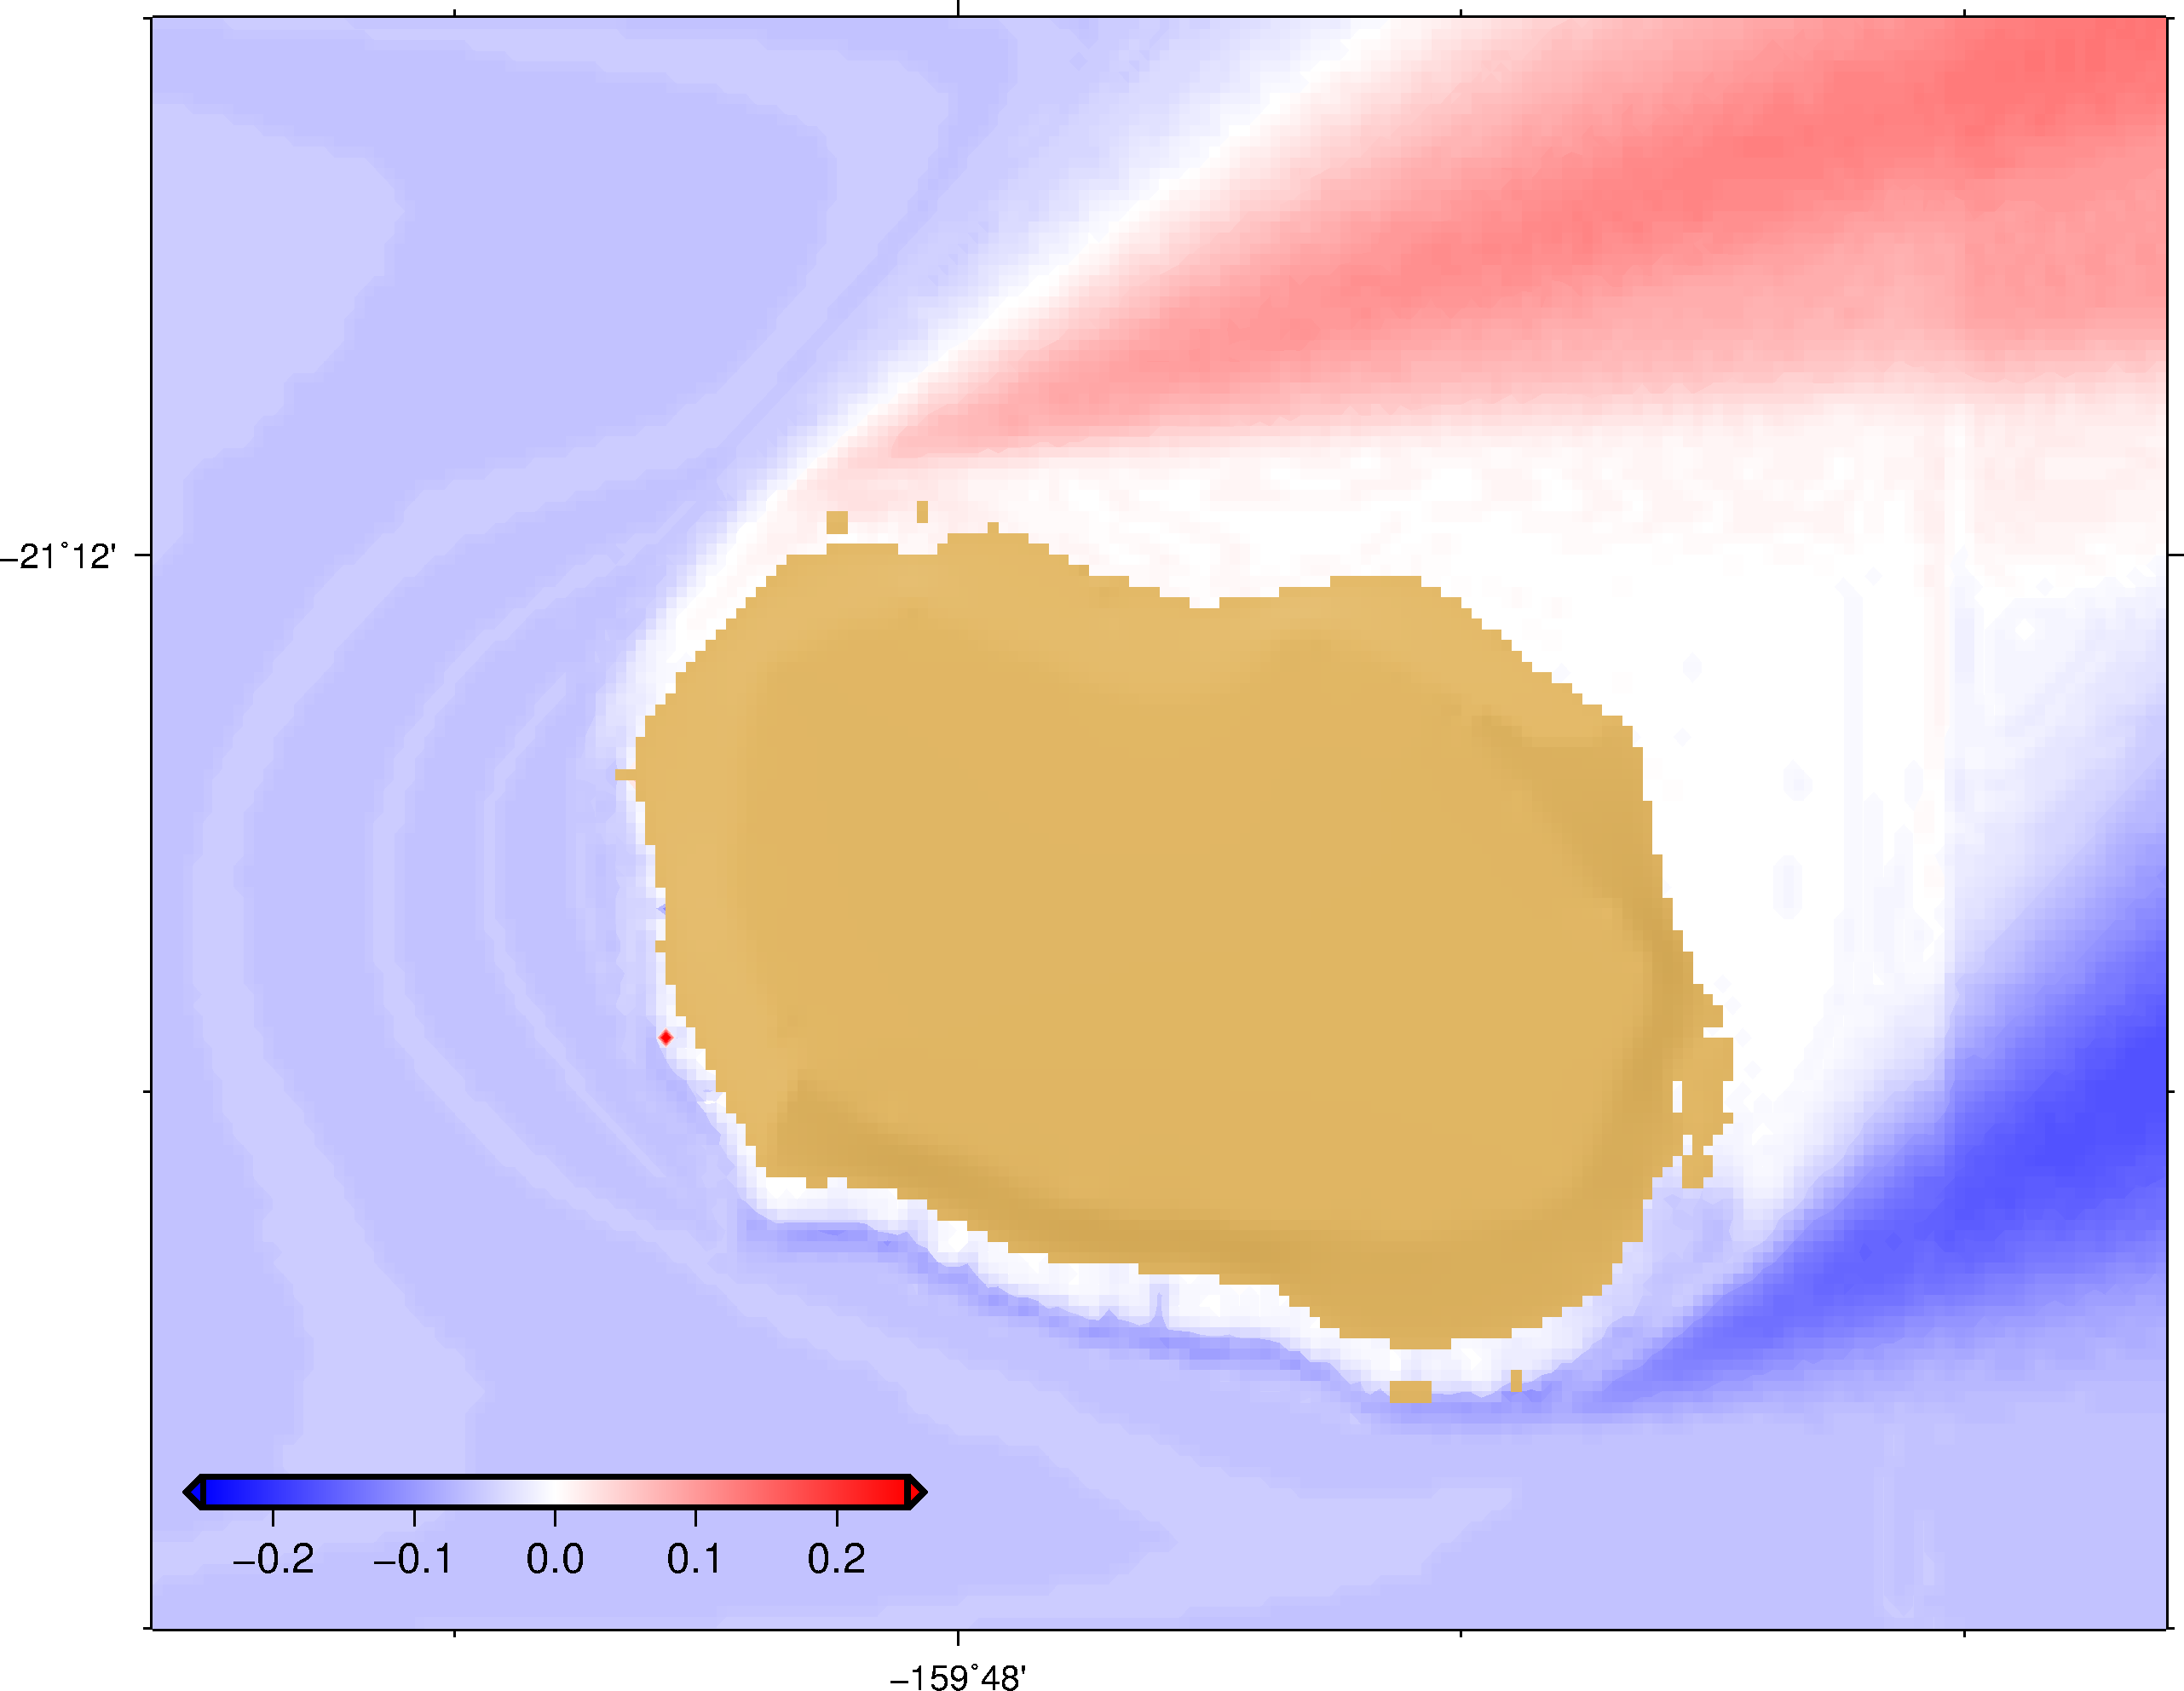
The maps below show the changes in the mean significant wave height for End of 21st Century (END21C) RCP4.5 scenario.
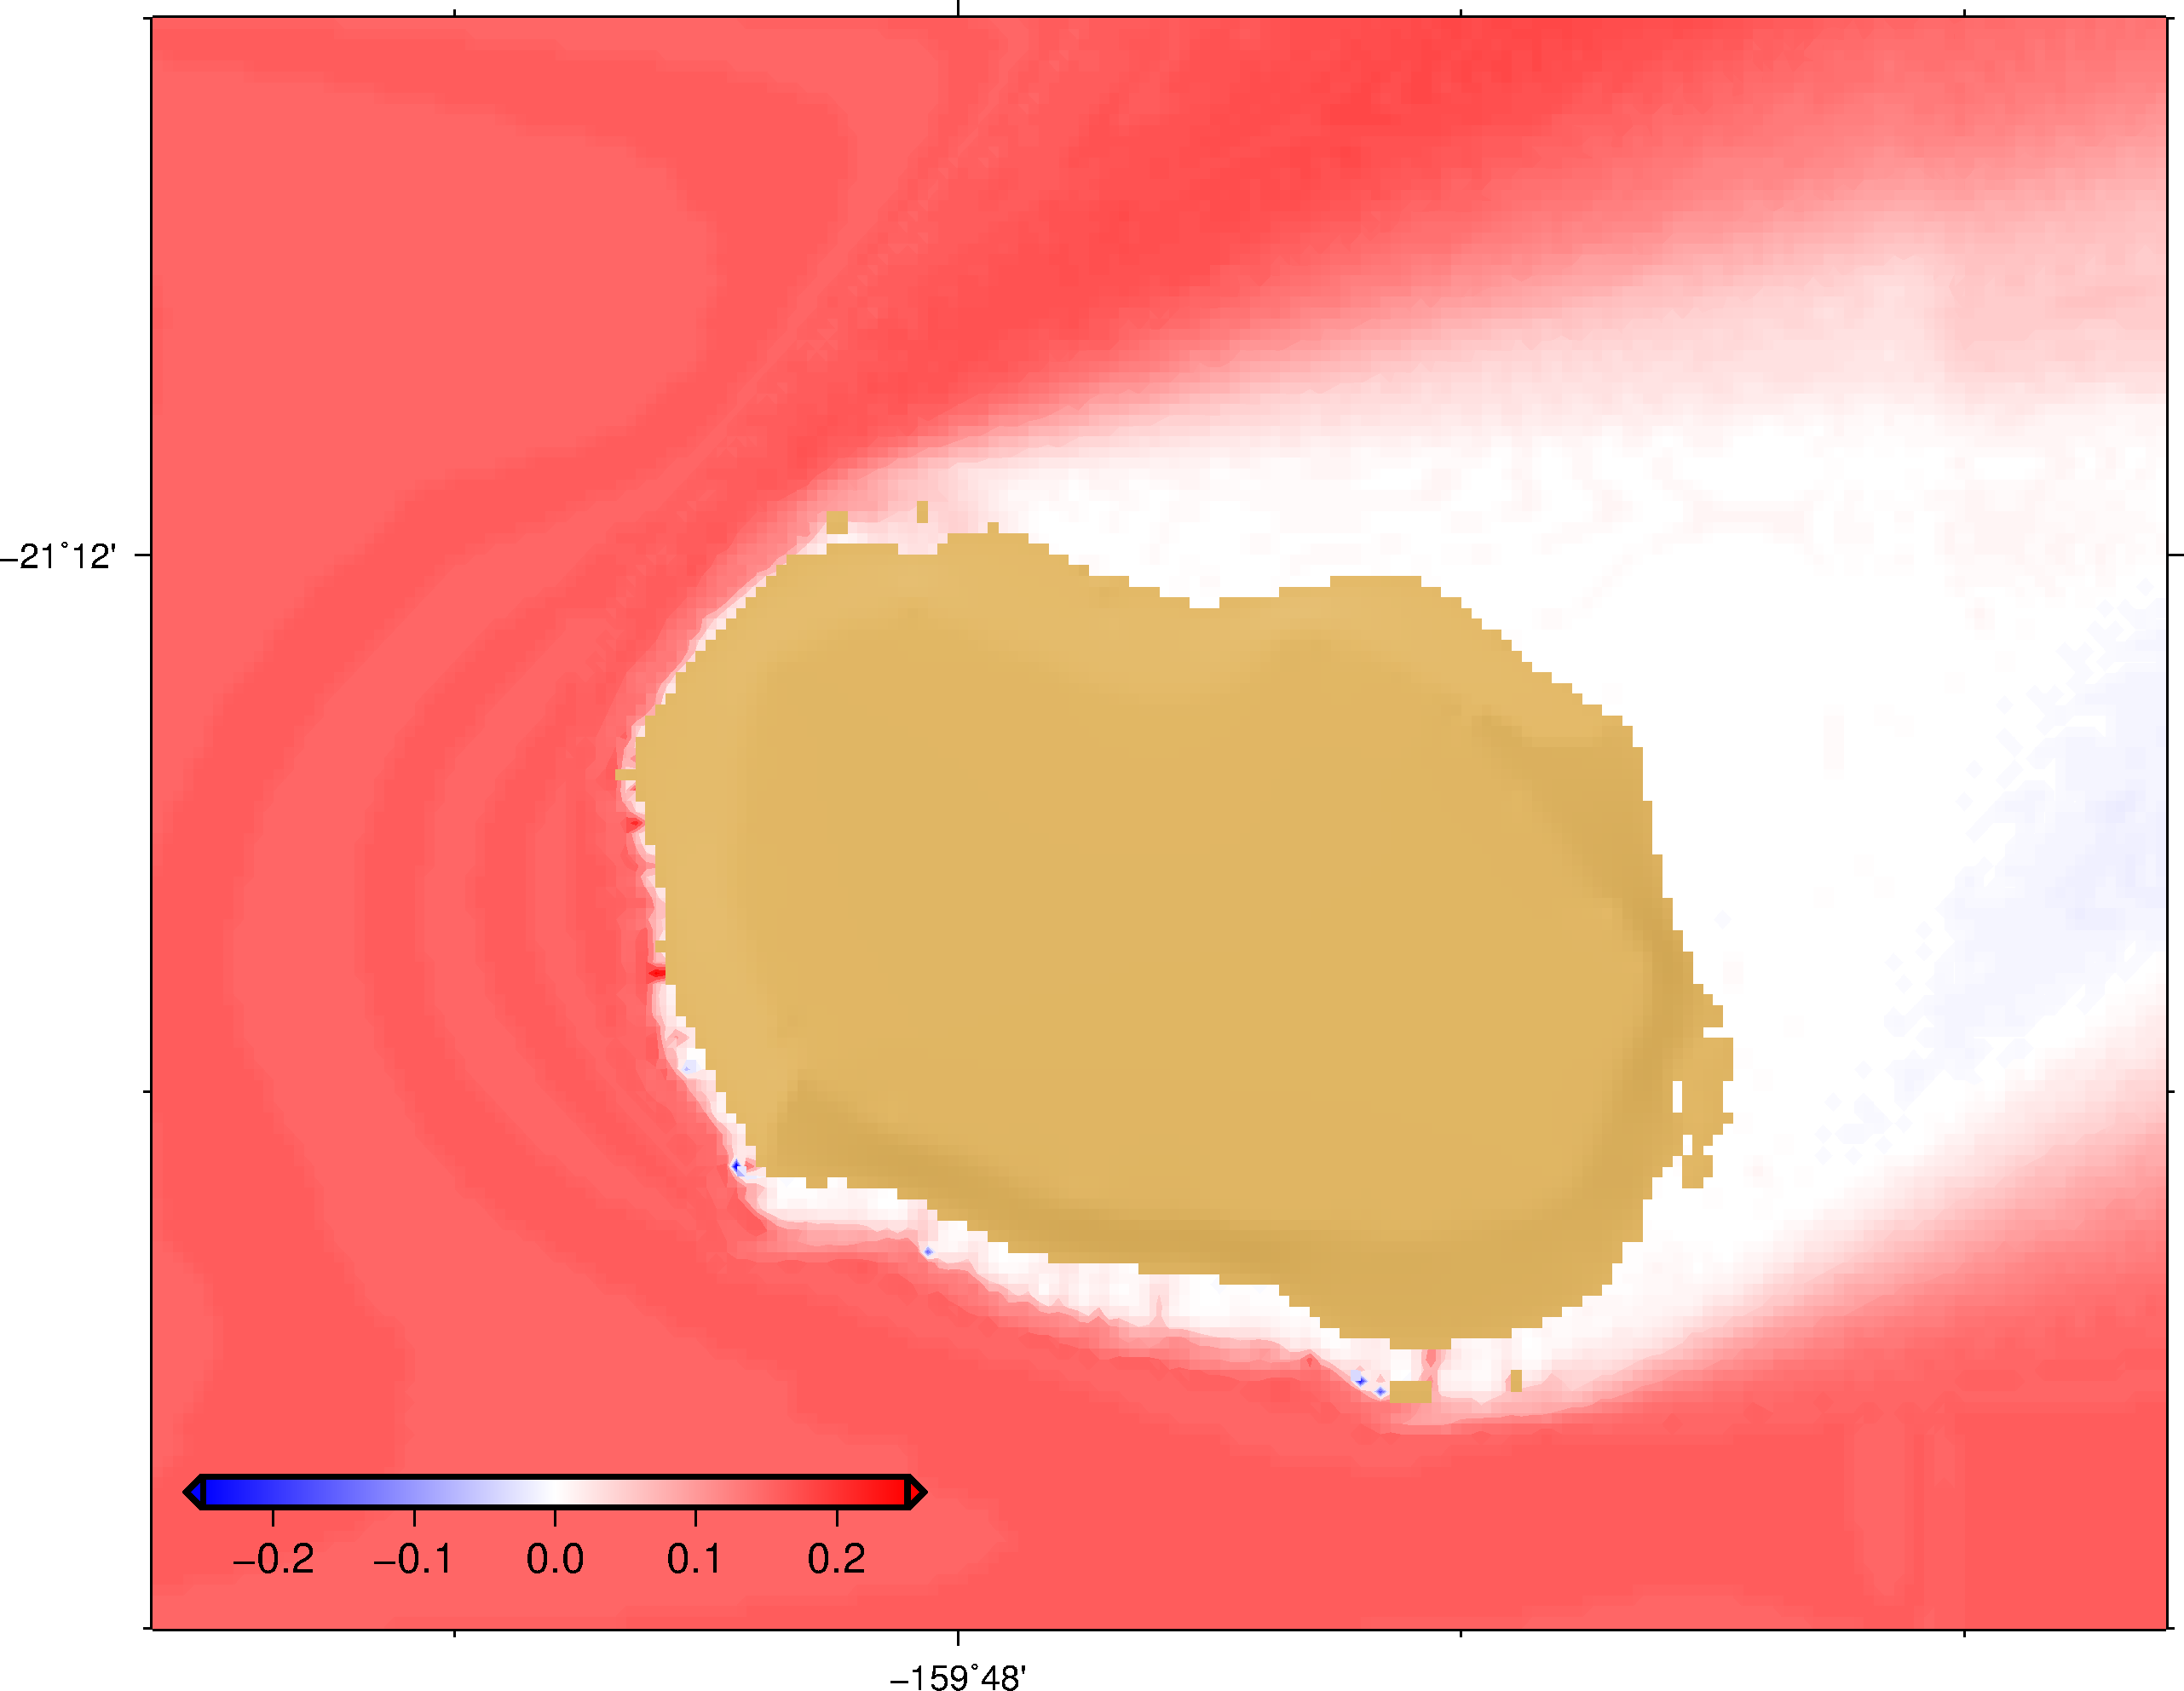
RCP 4.5 Hs Change for January
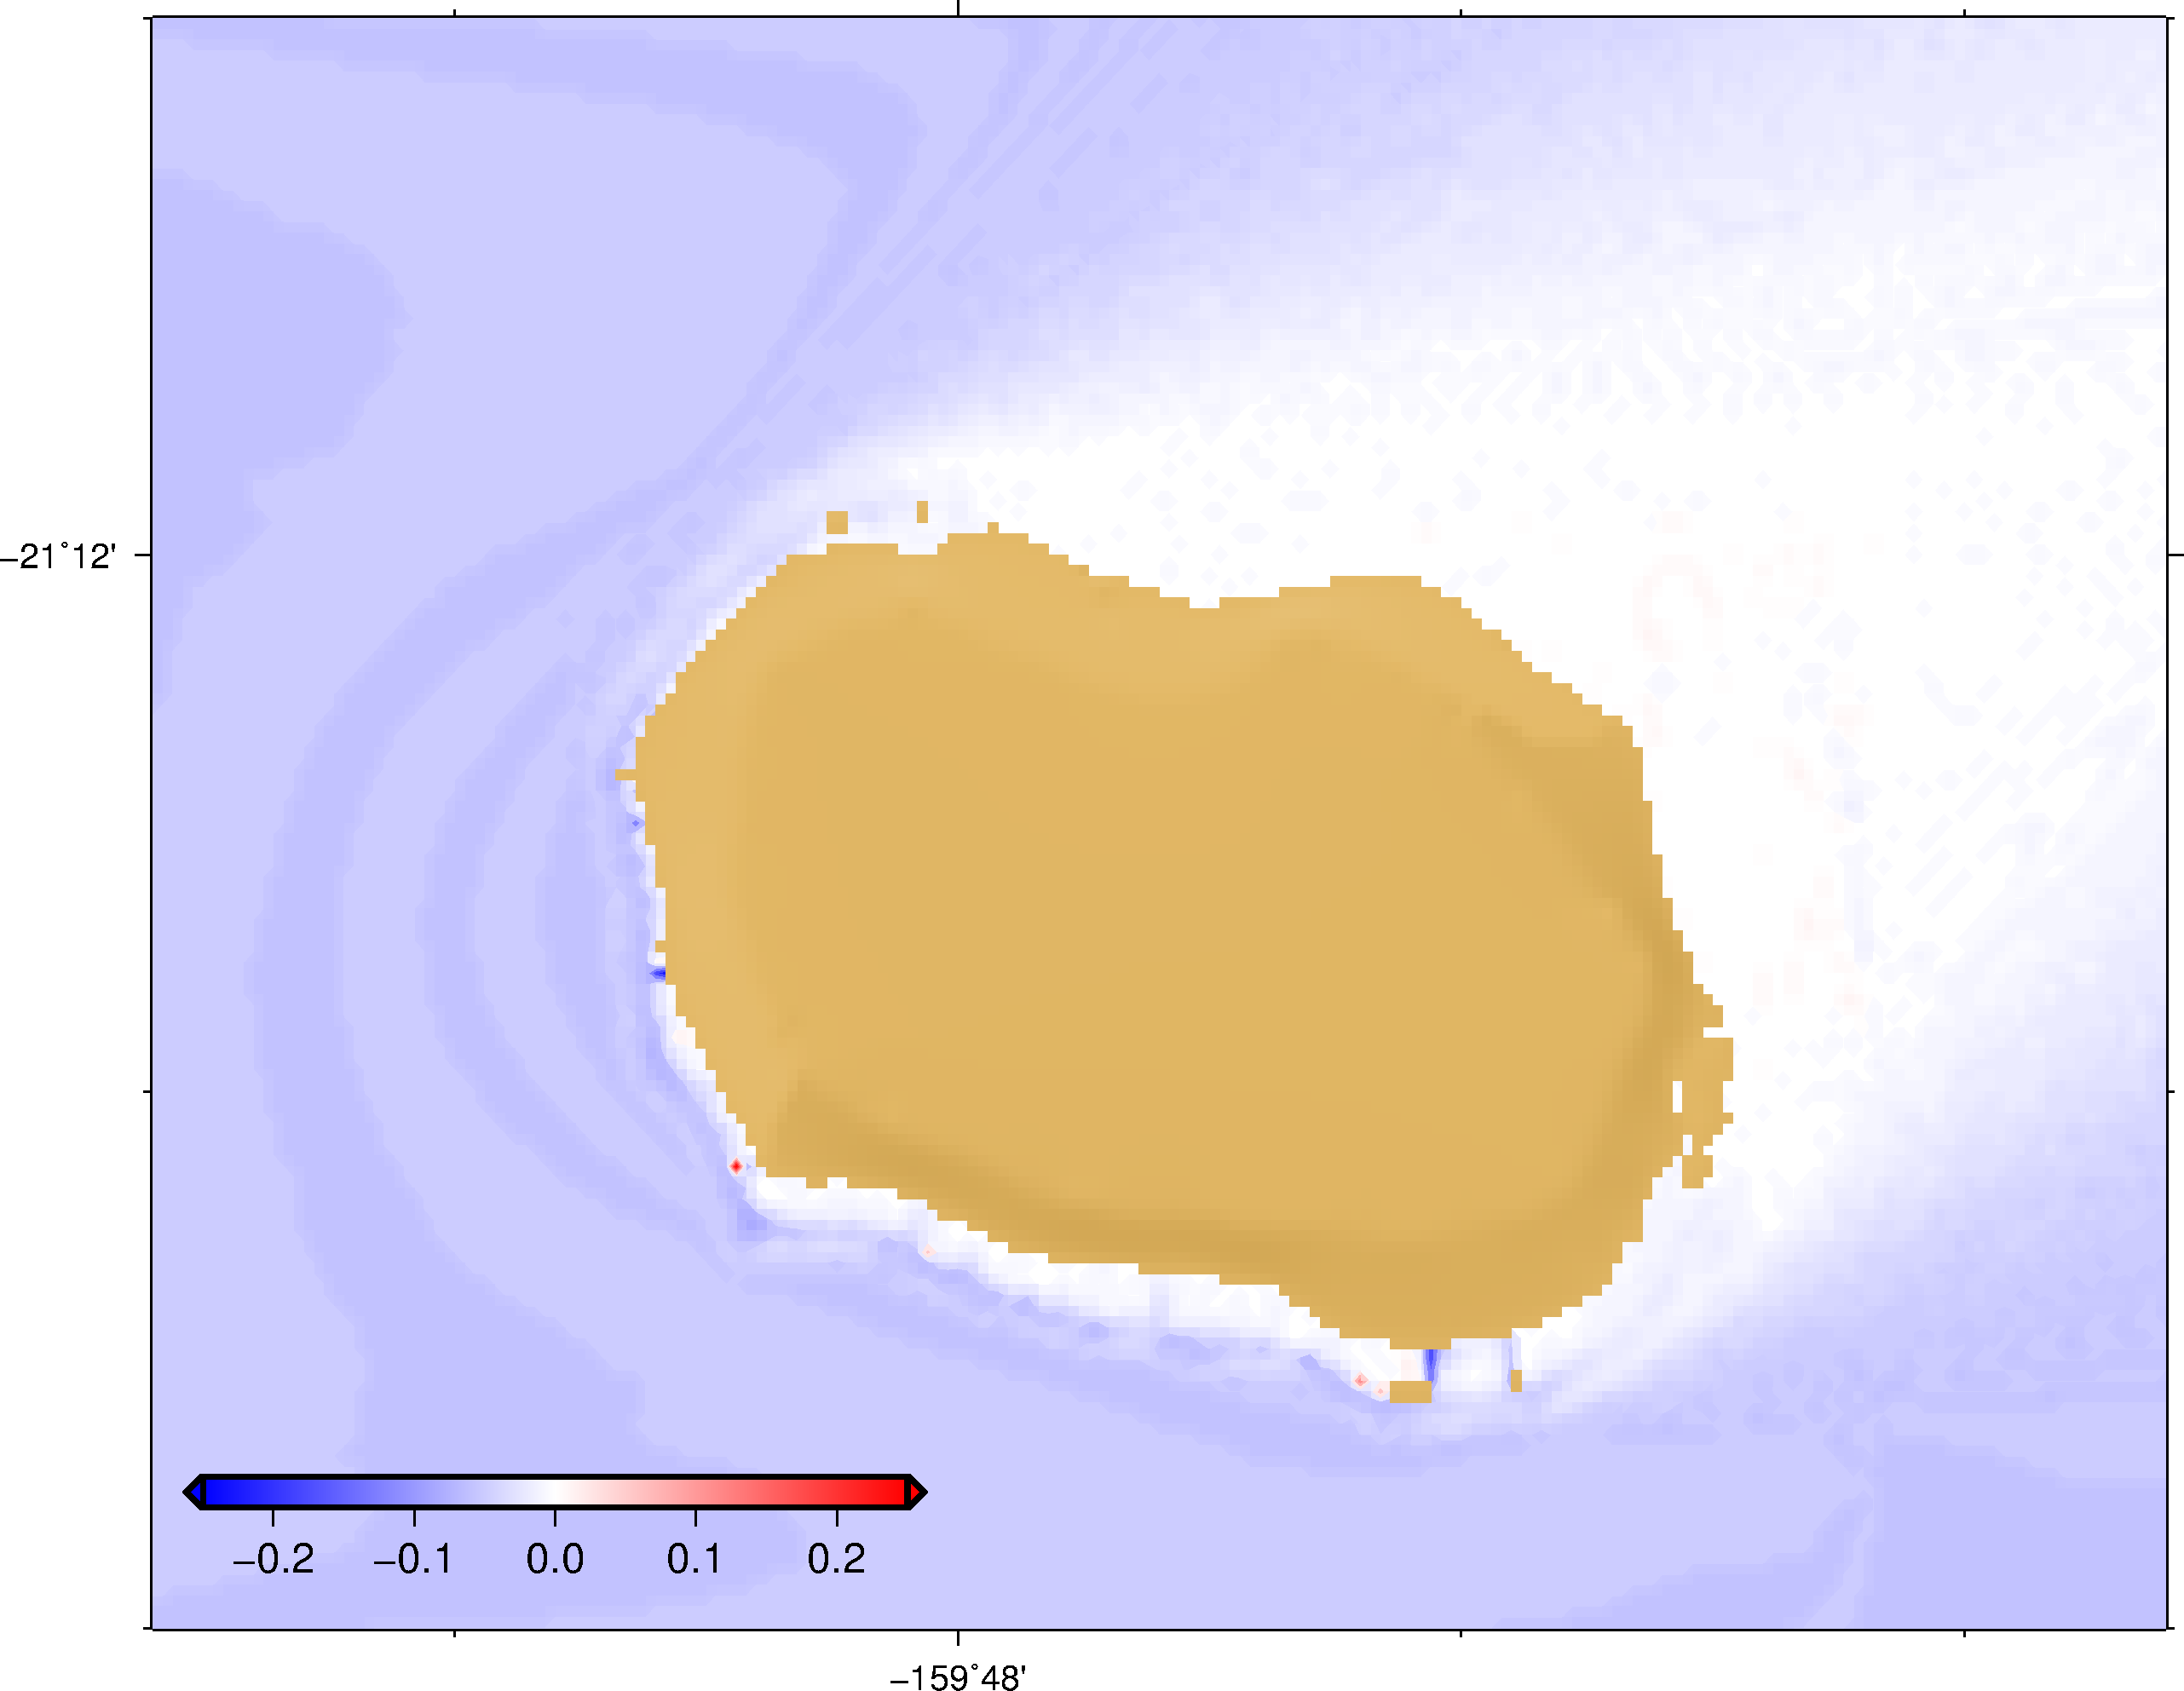
RCP 4.5 Hs Change for February
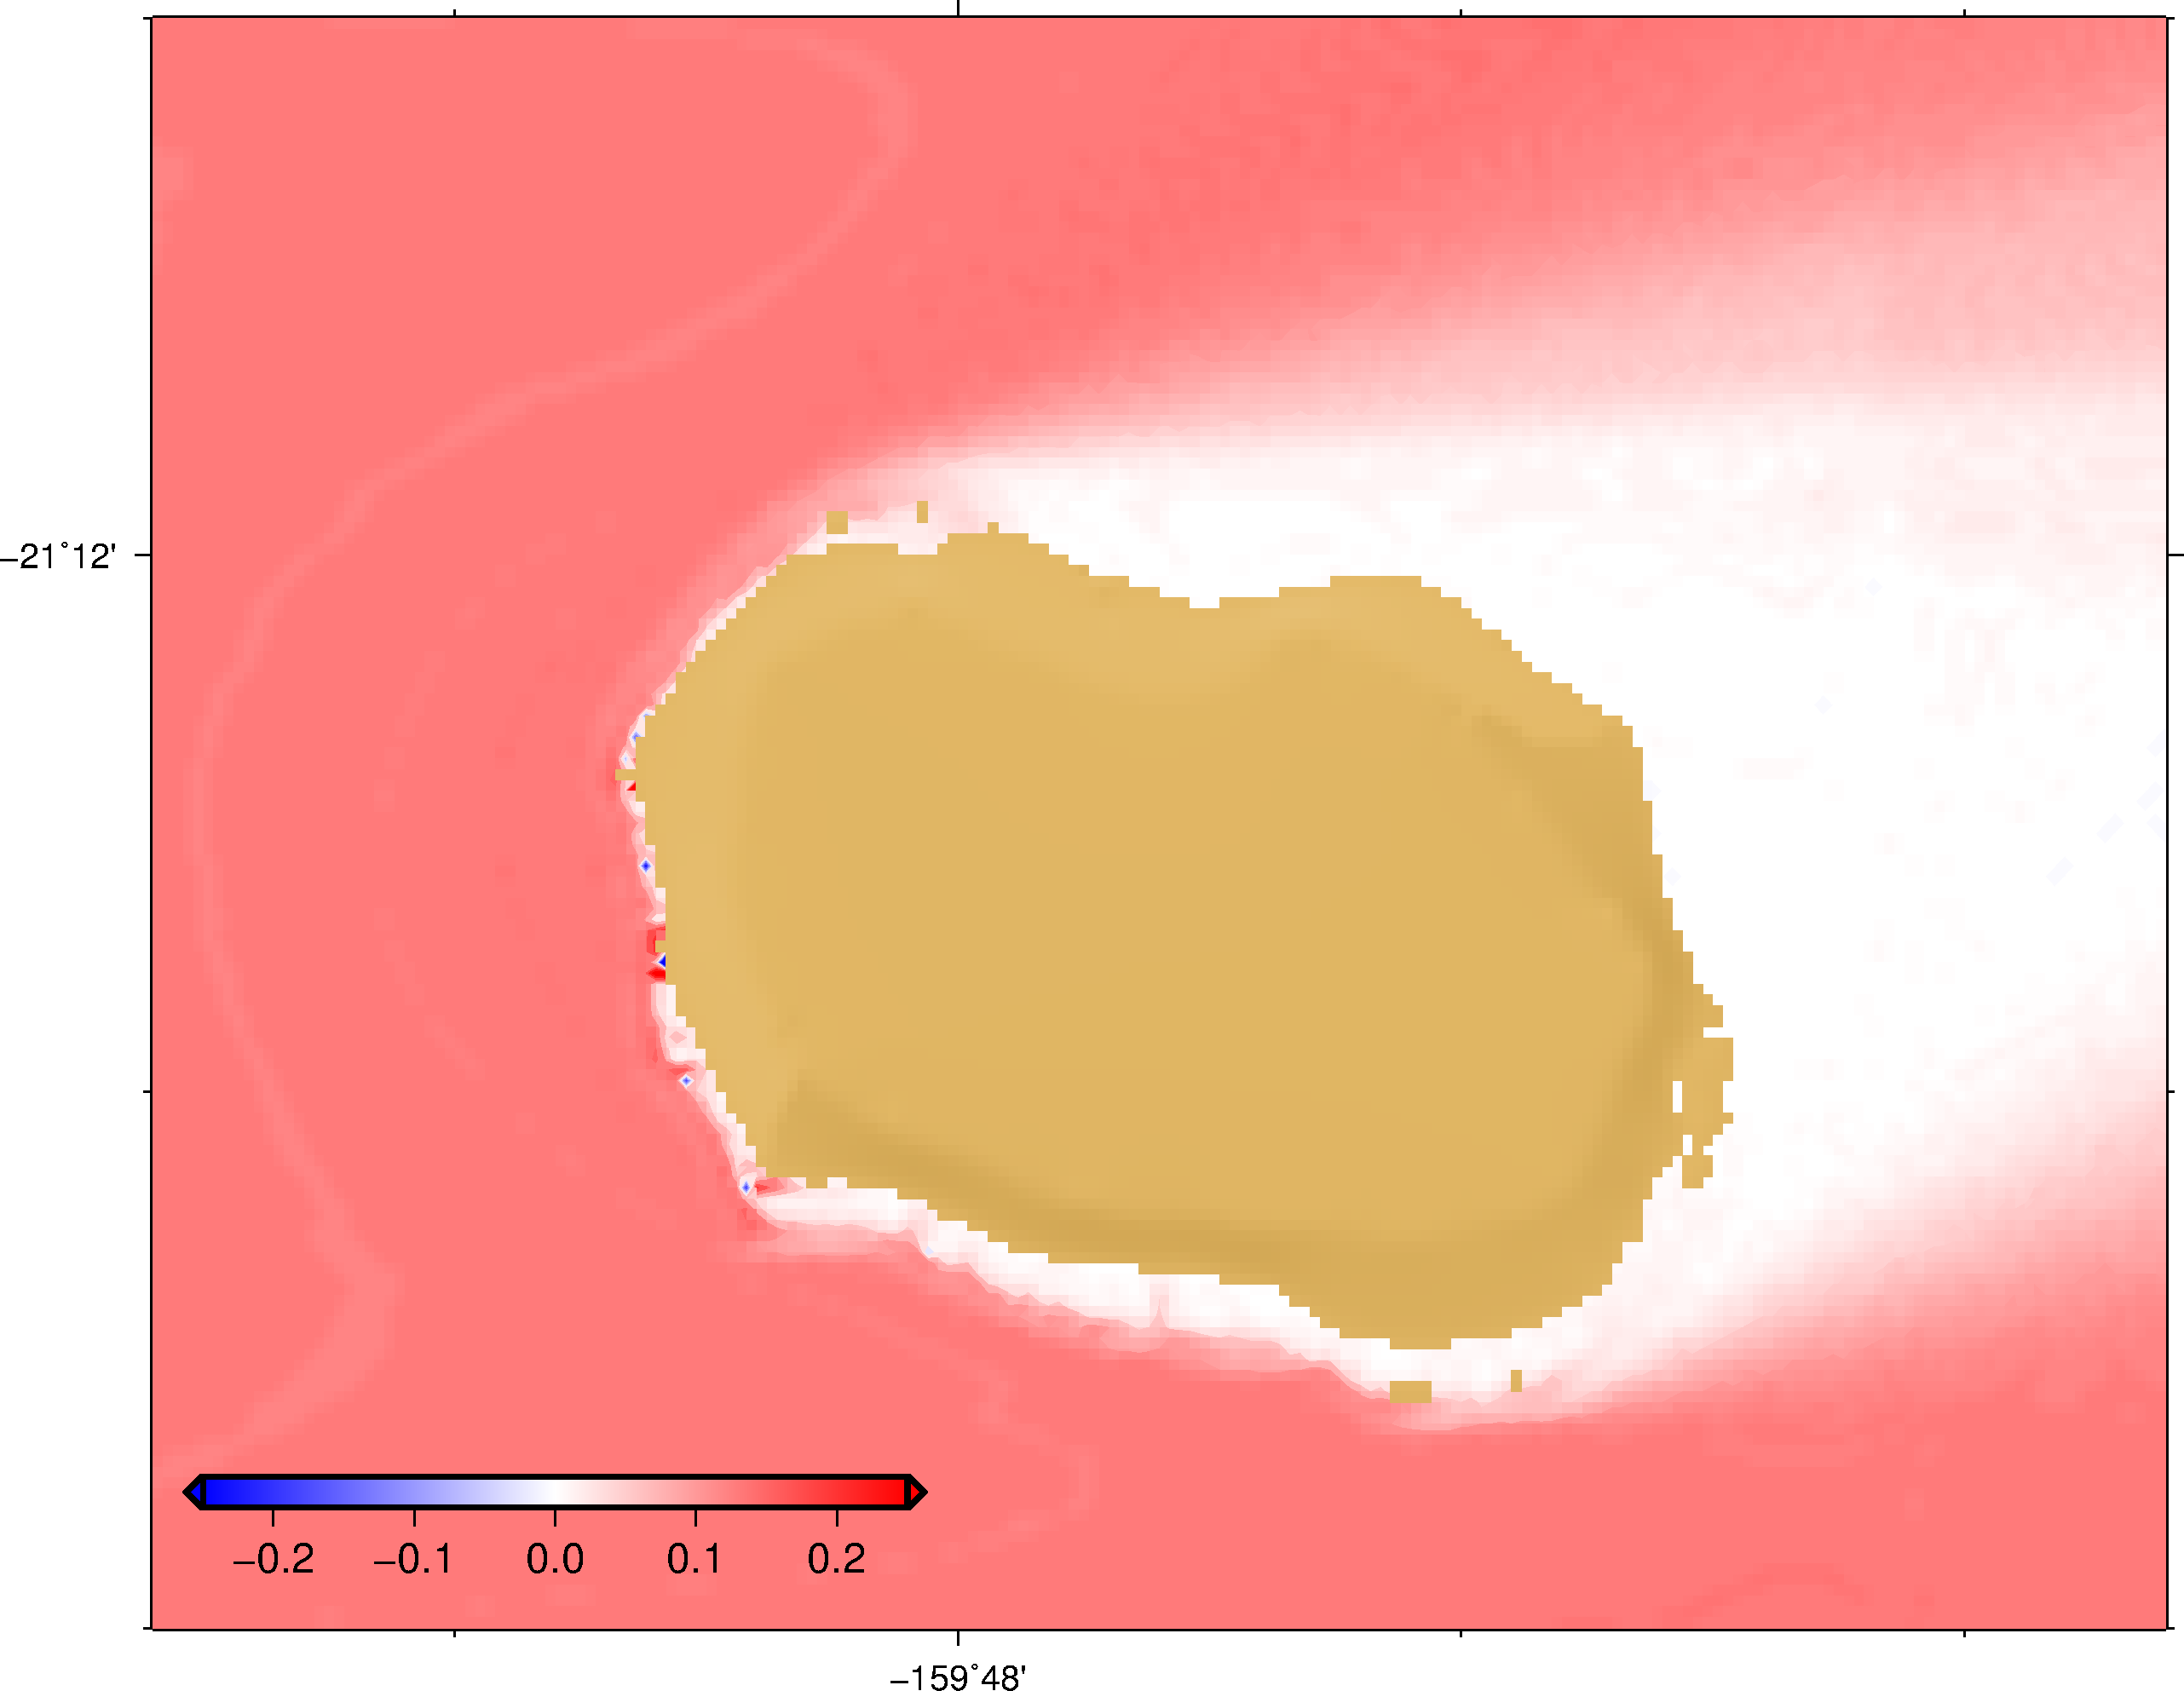
RCP 4.5 Hs Change for March
RCP 4.5 Hs Change for April
RCP 4.5 Hs Change for May
RCP 4.5 Hs Change for June
RCP 4.5 Hs Change for July
RCP 4.5 Hs Change for August
RCP 4.5 Hs Change for September
RCP 4.5 Hs Change for October
RCP 4.5 Hs Change for November
RCP 4.5 Hs Change for December
Previous
Next
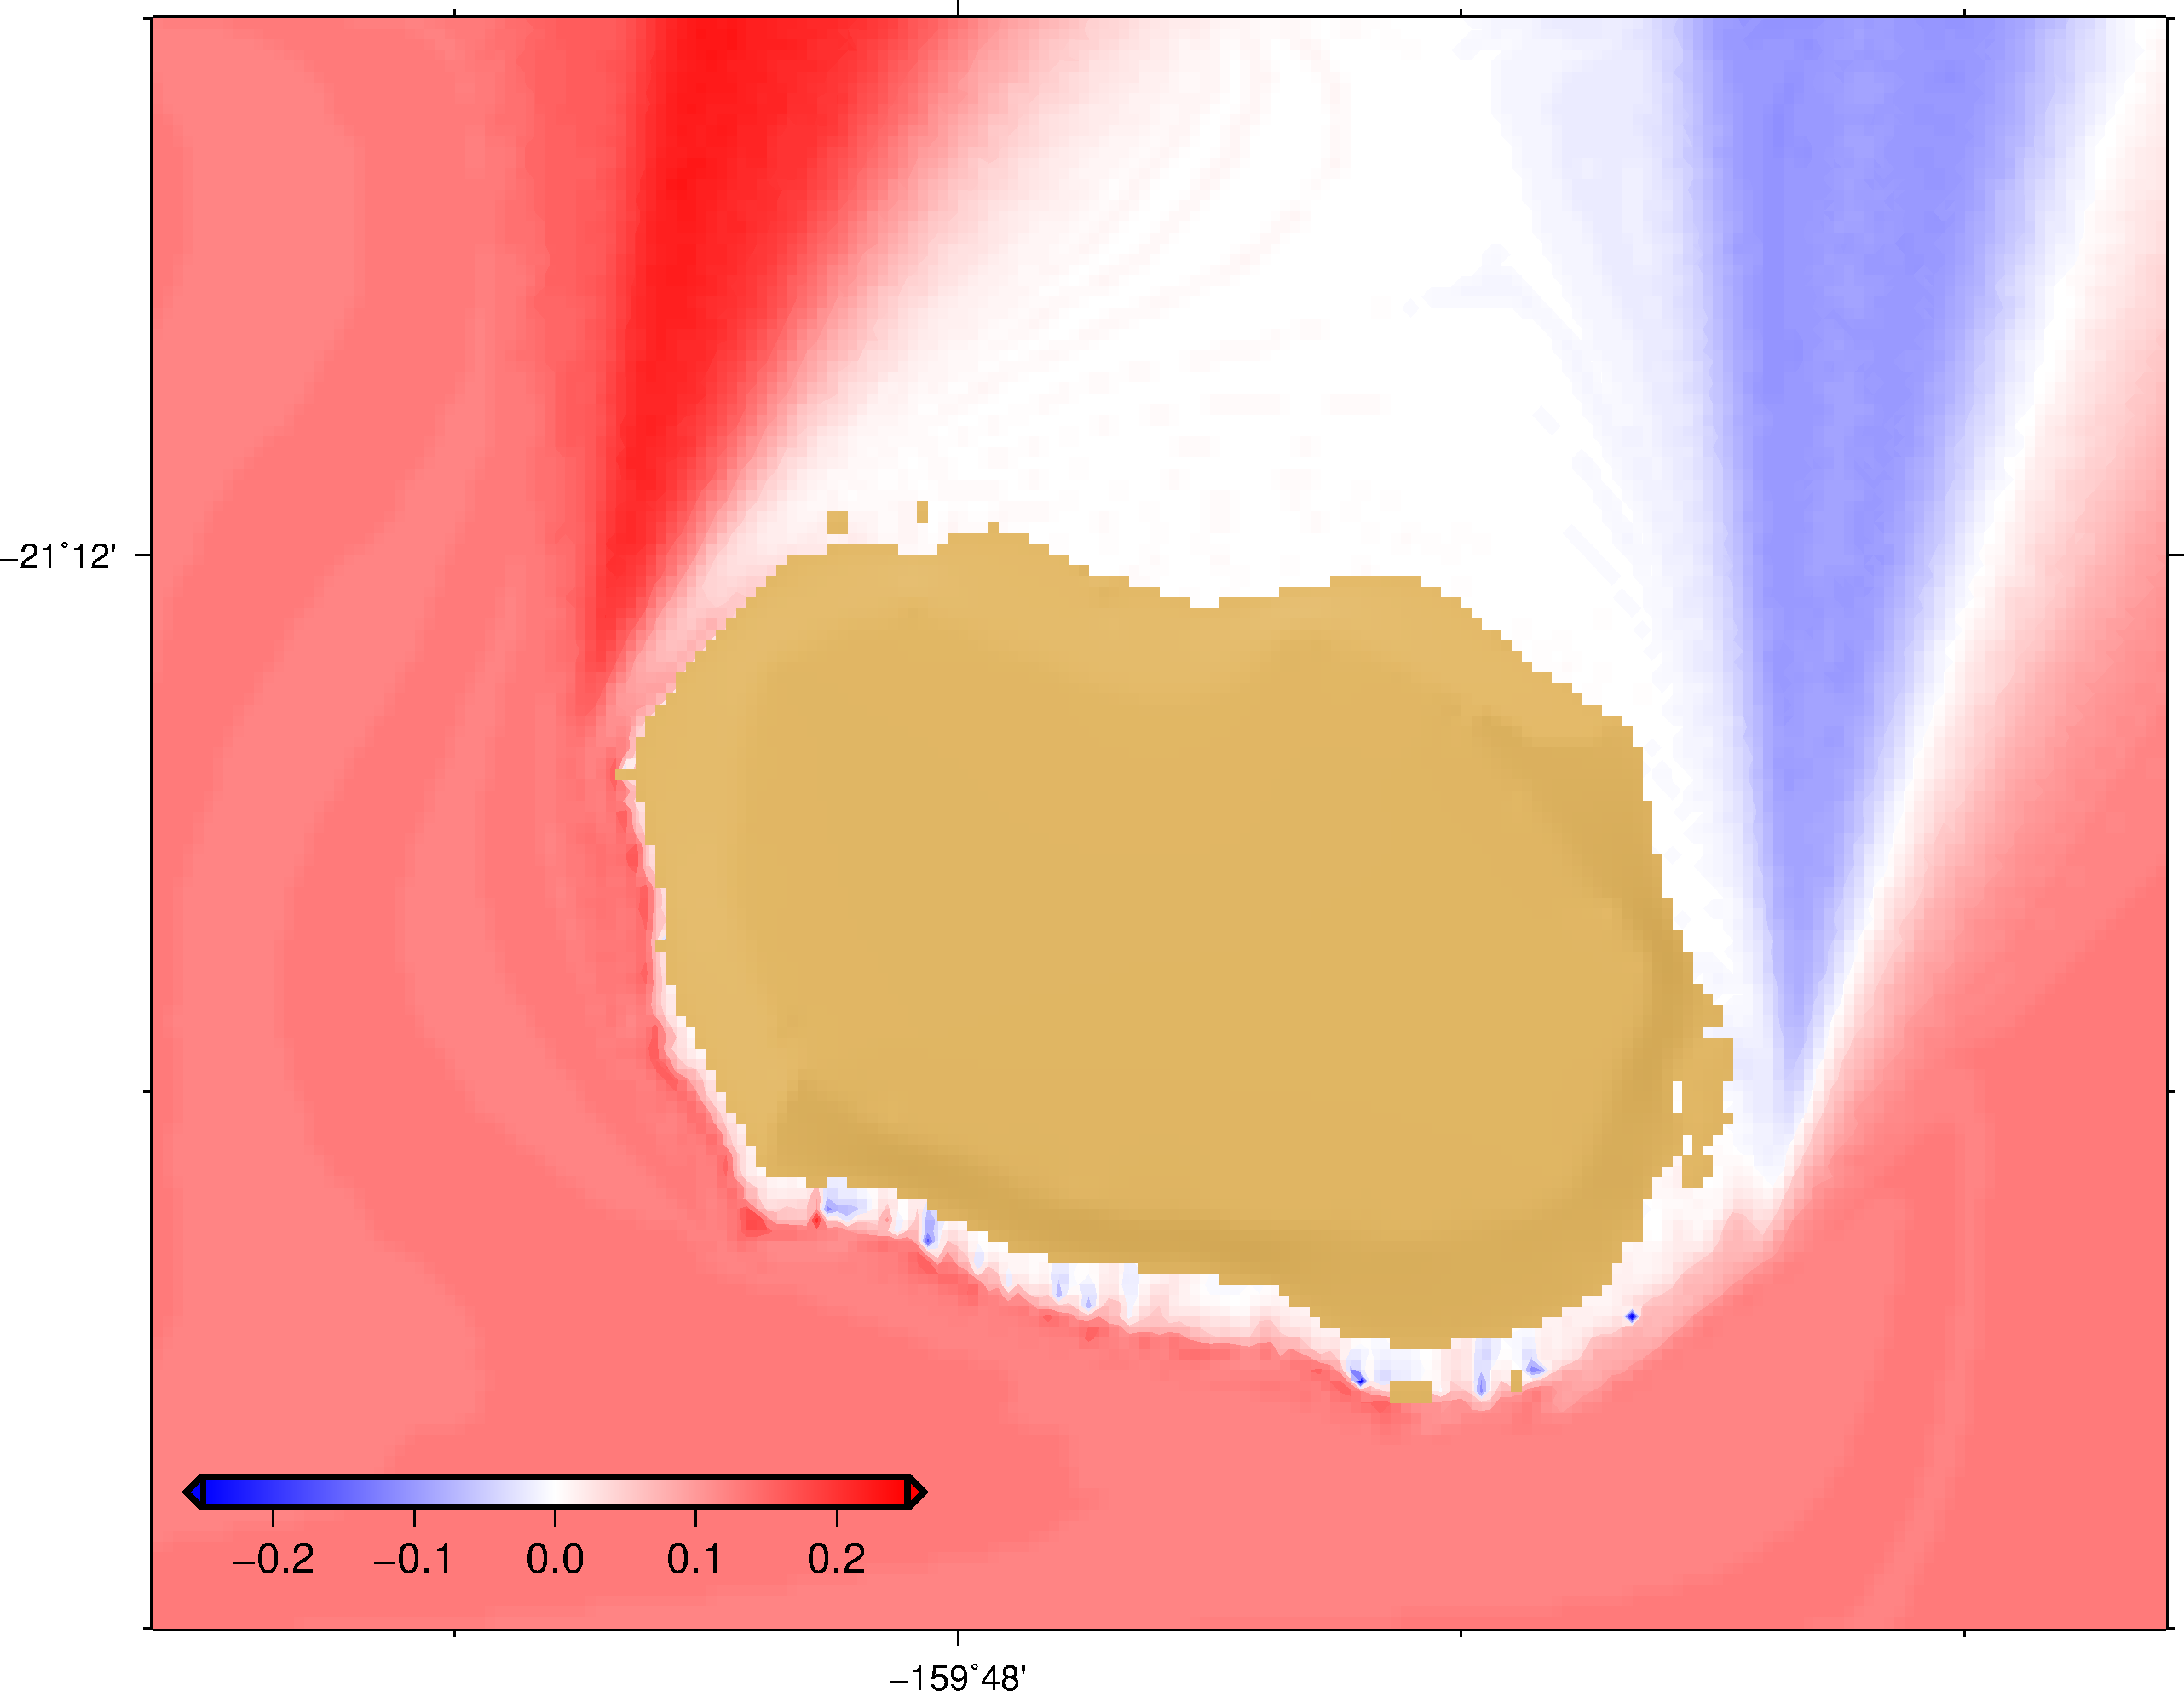
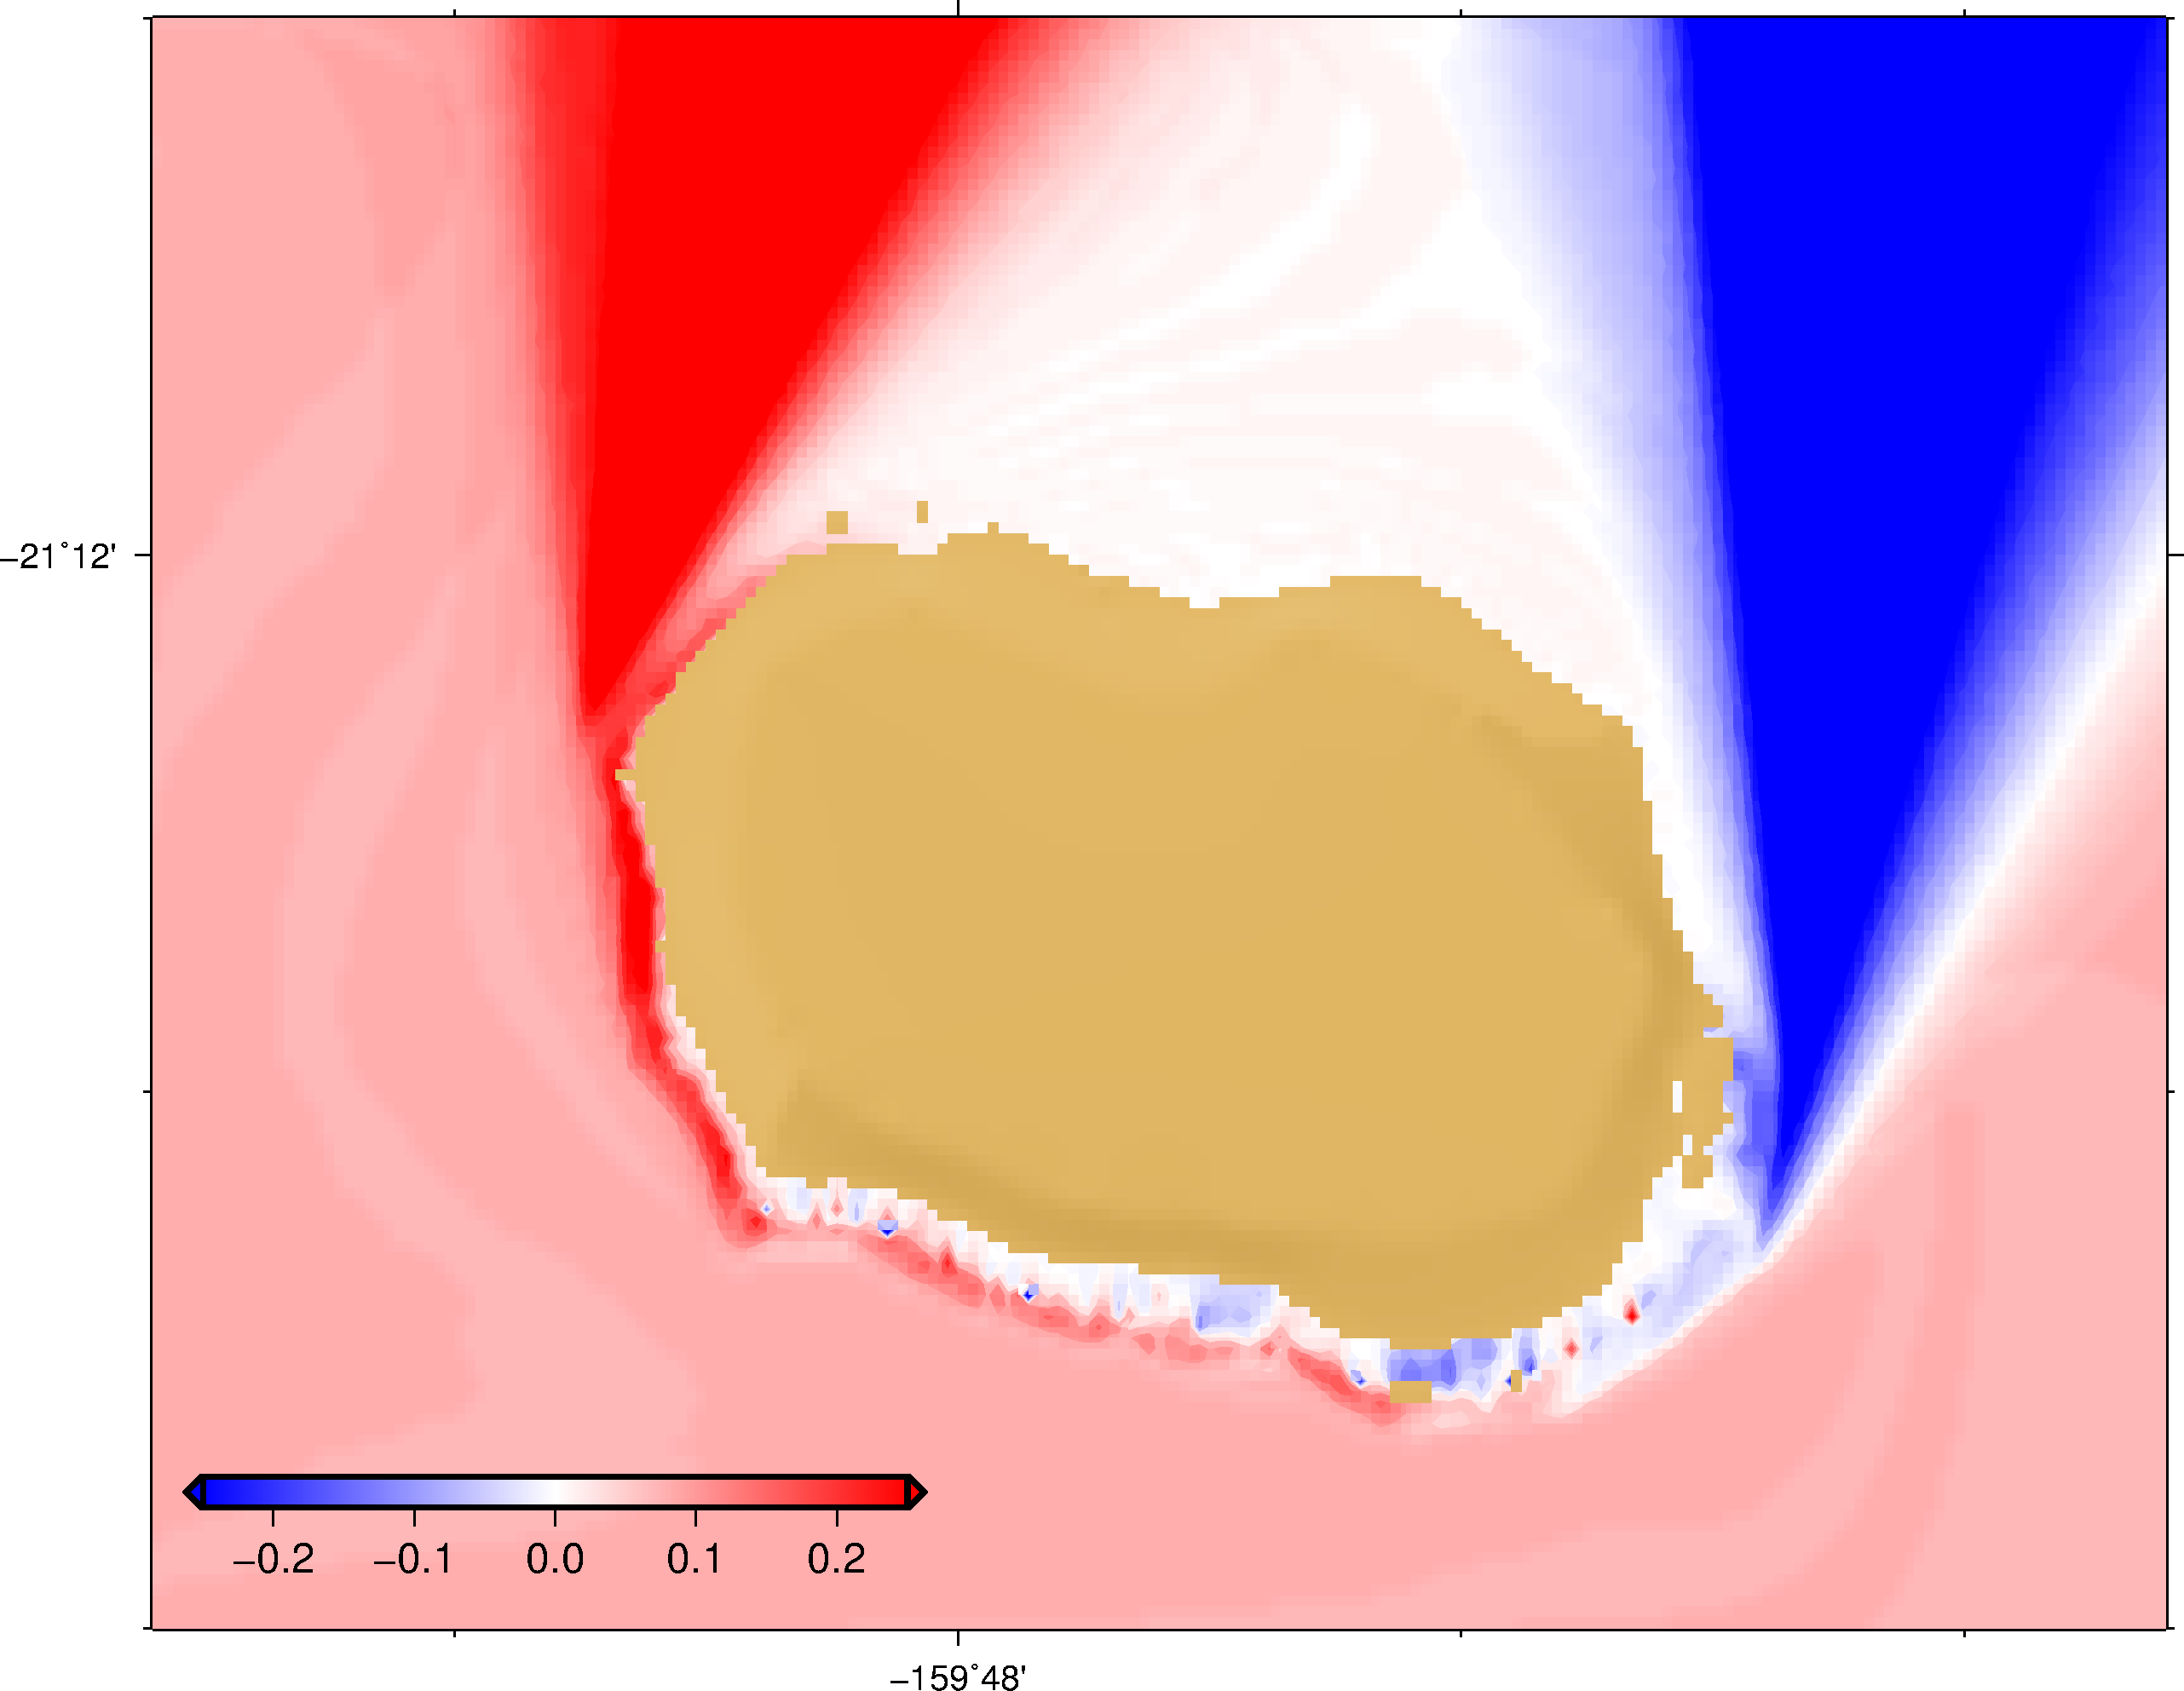
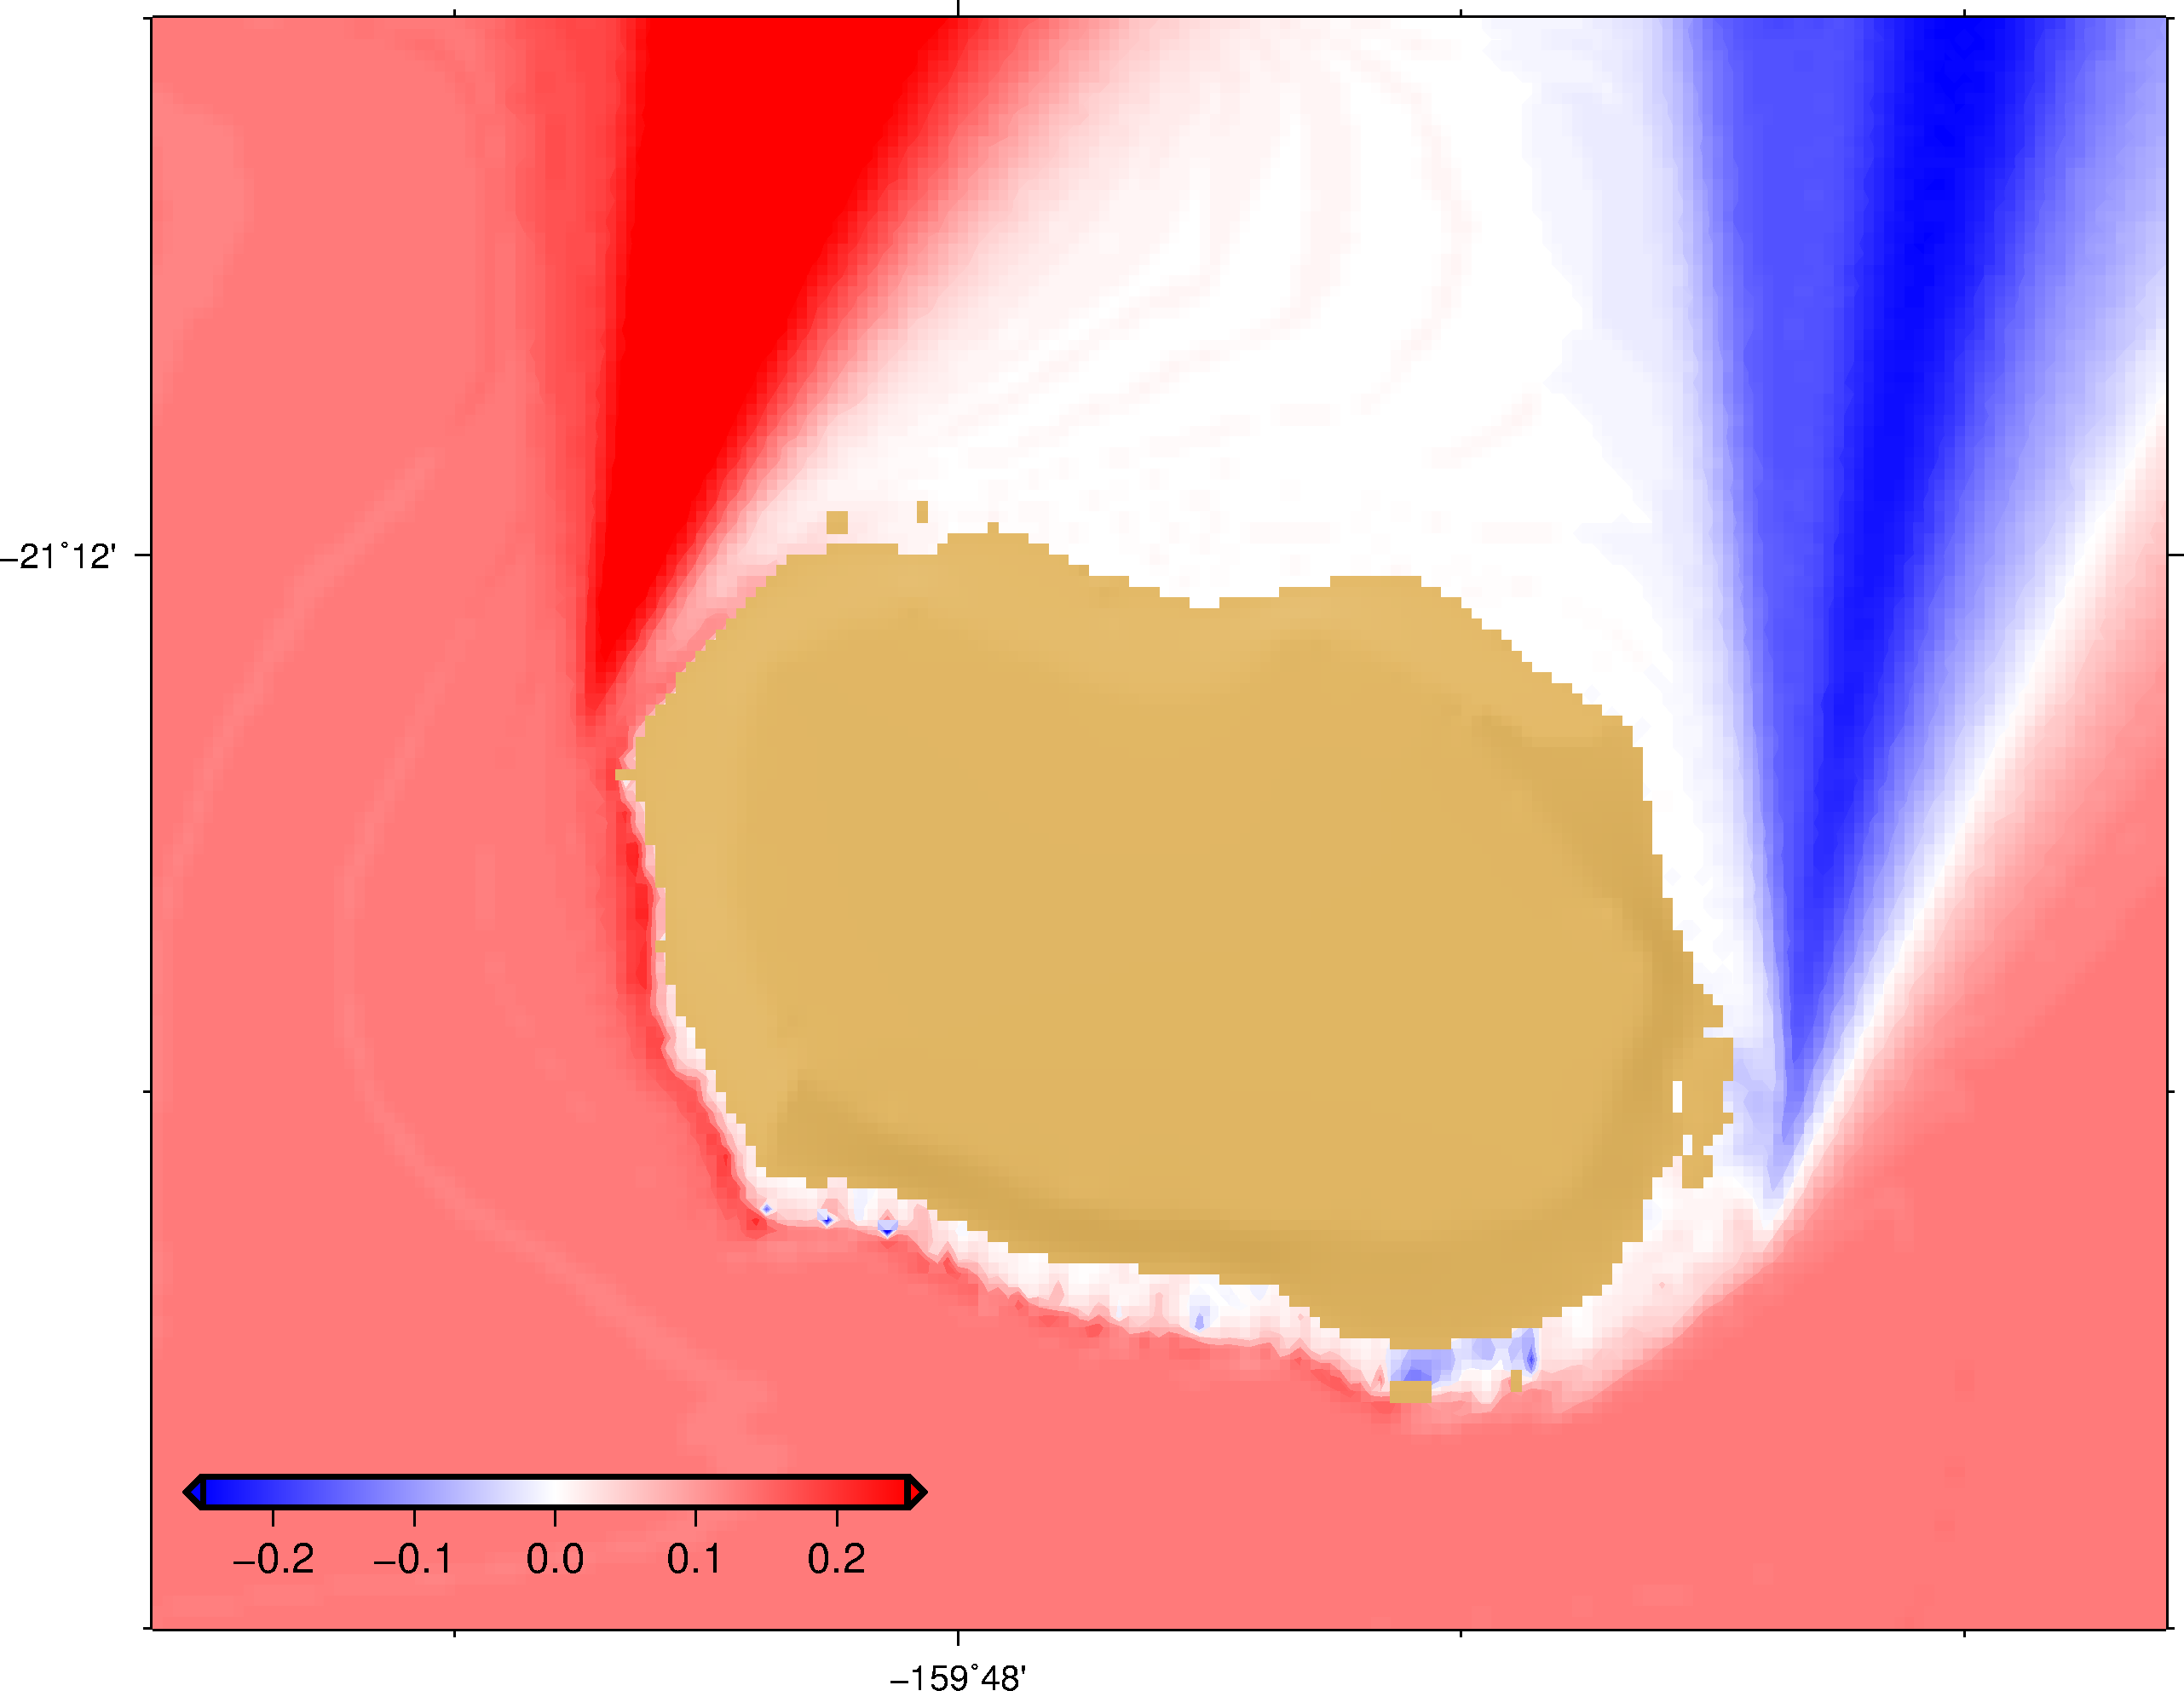
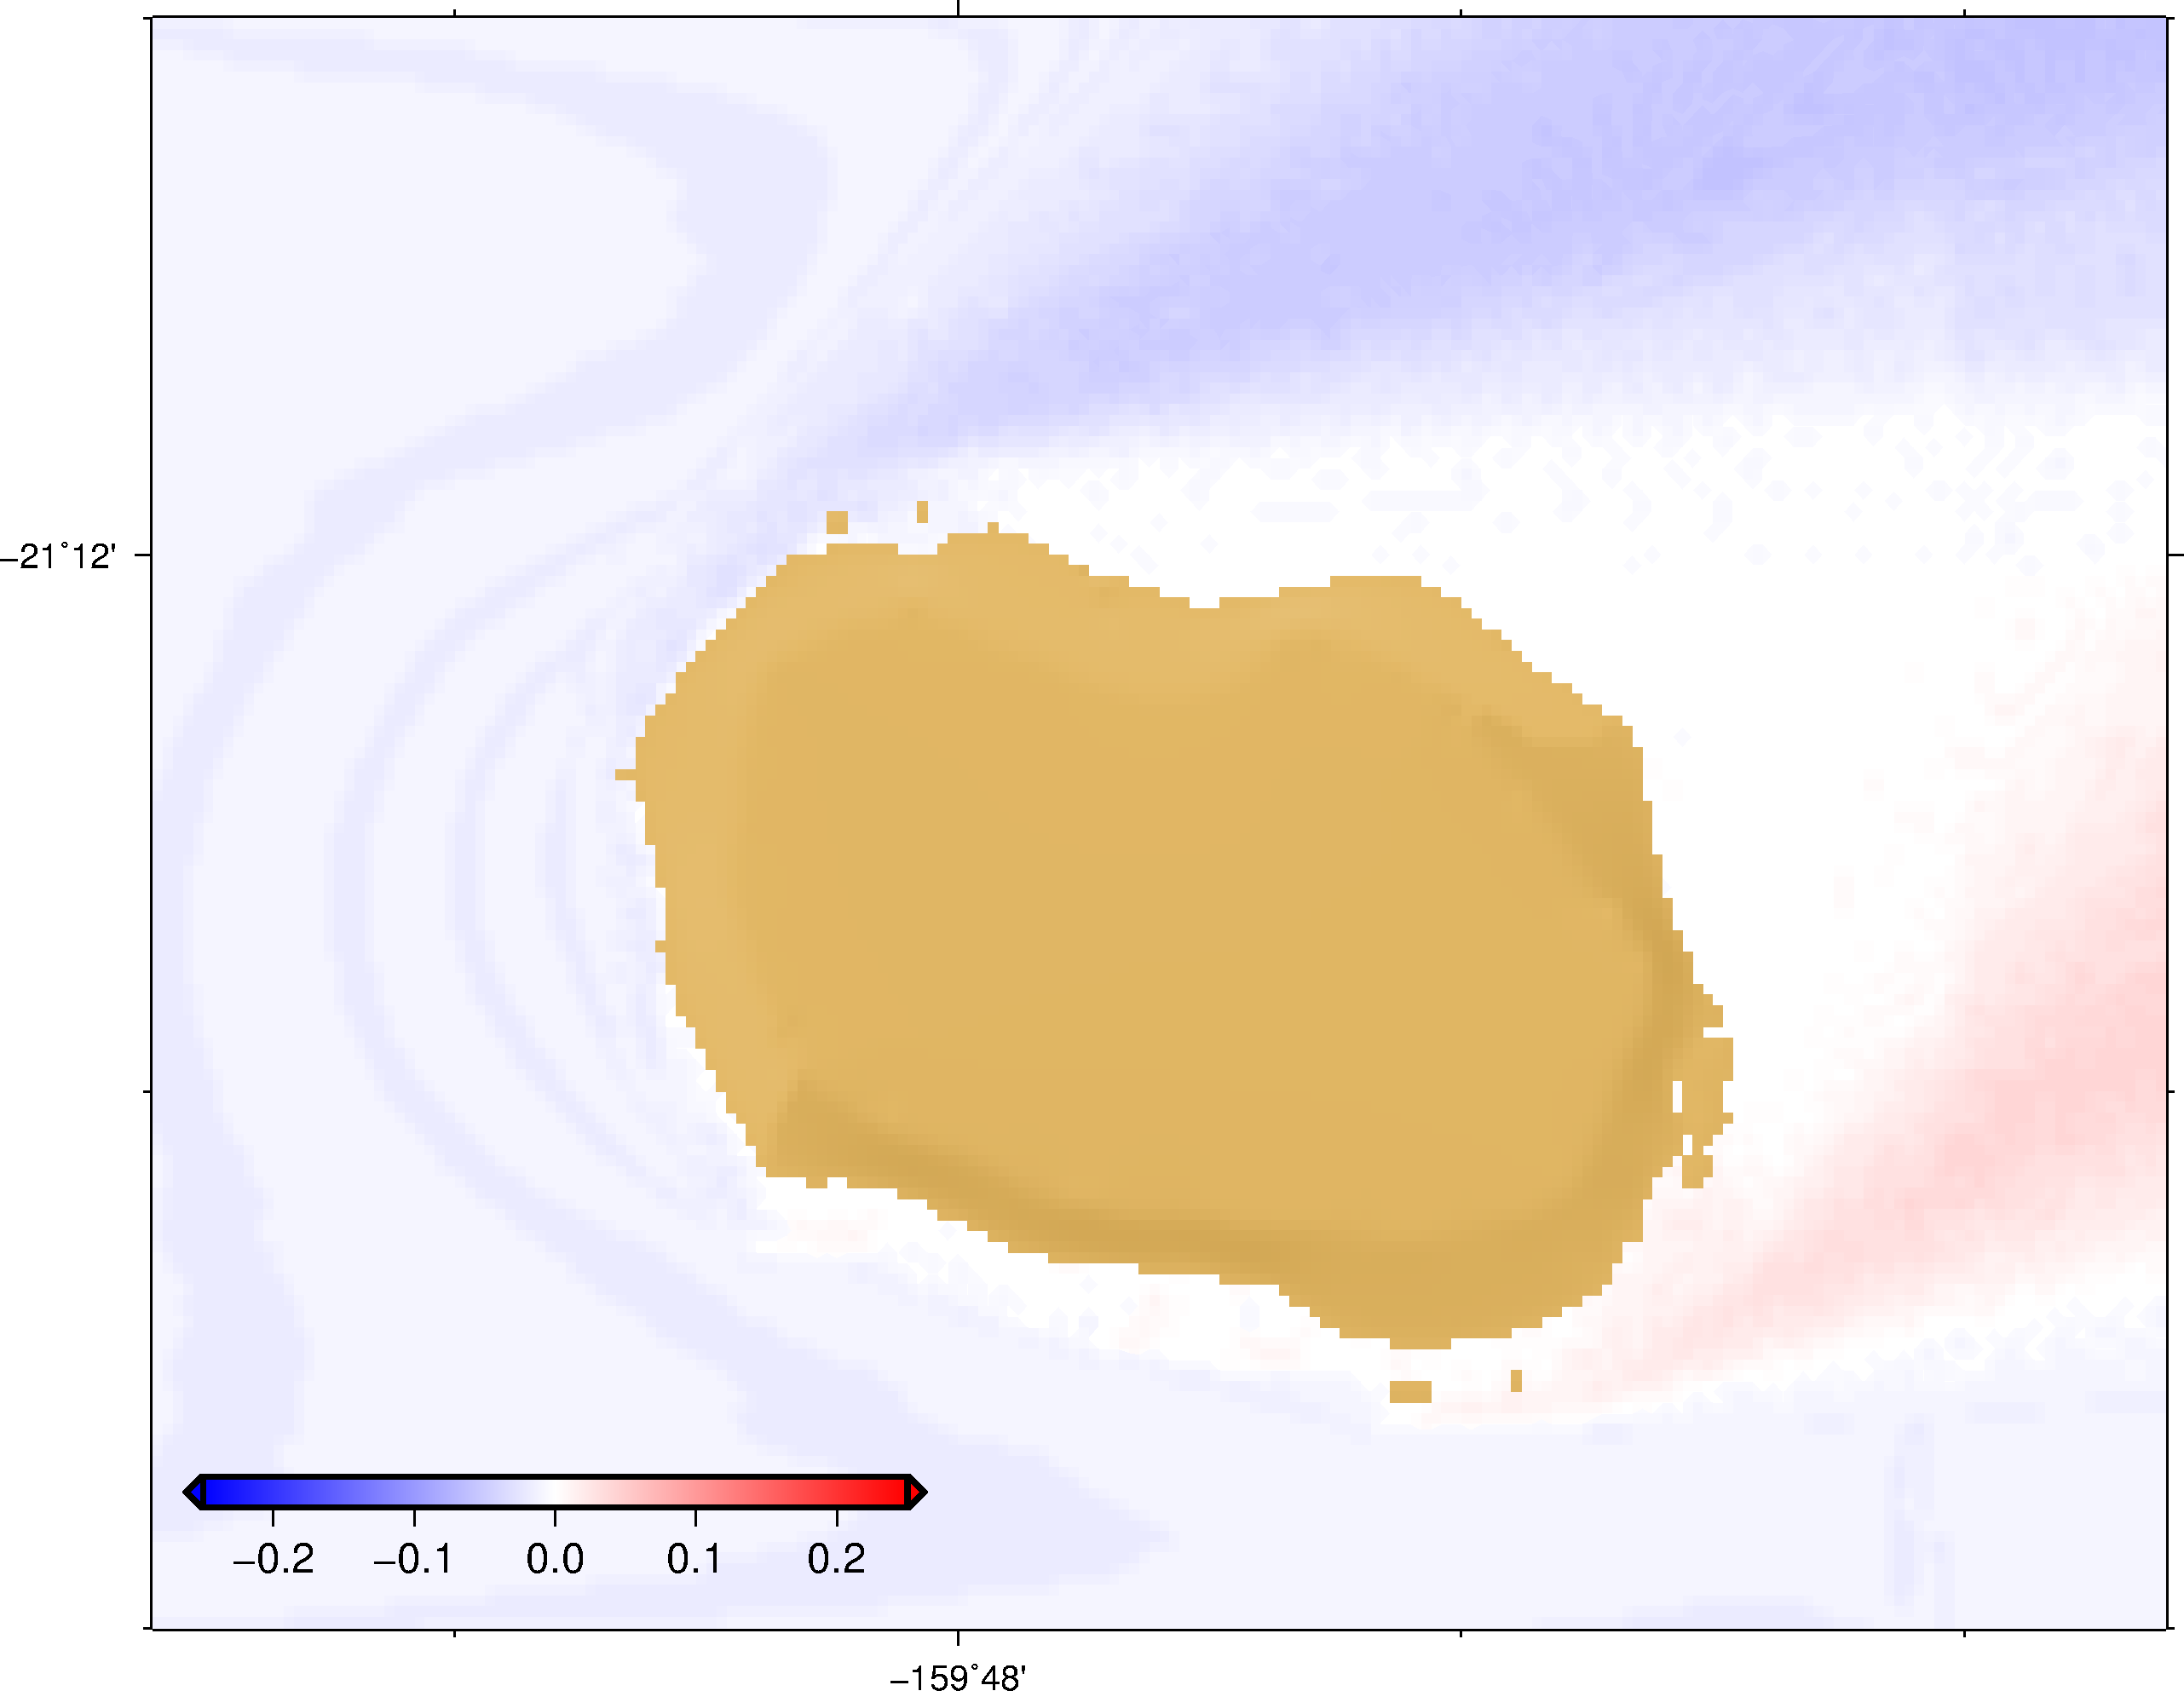
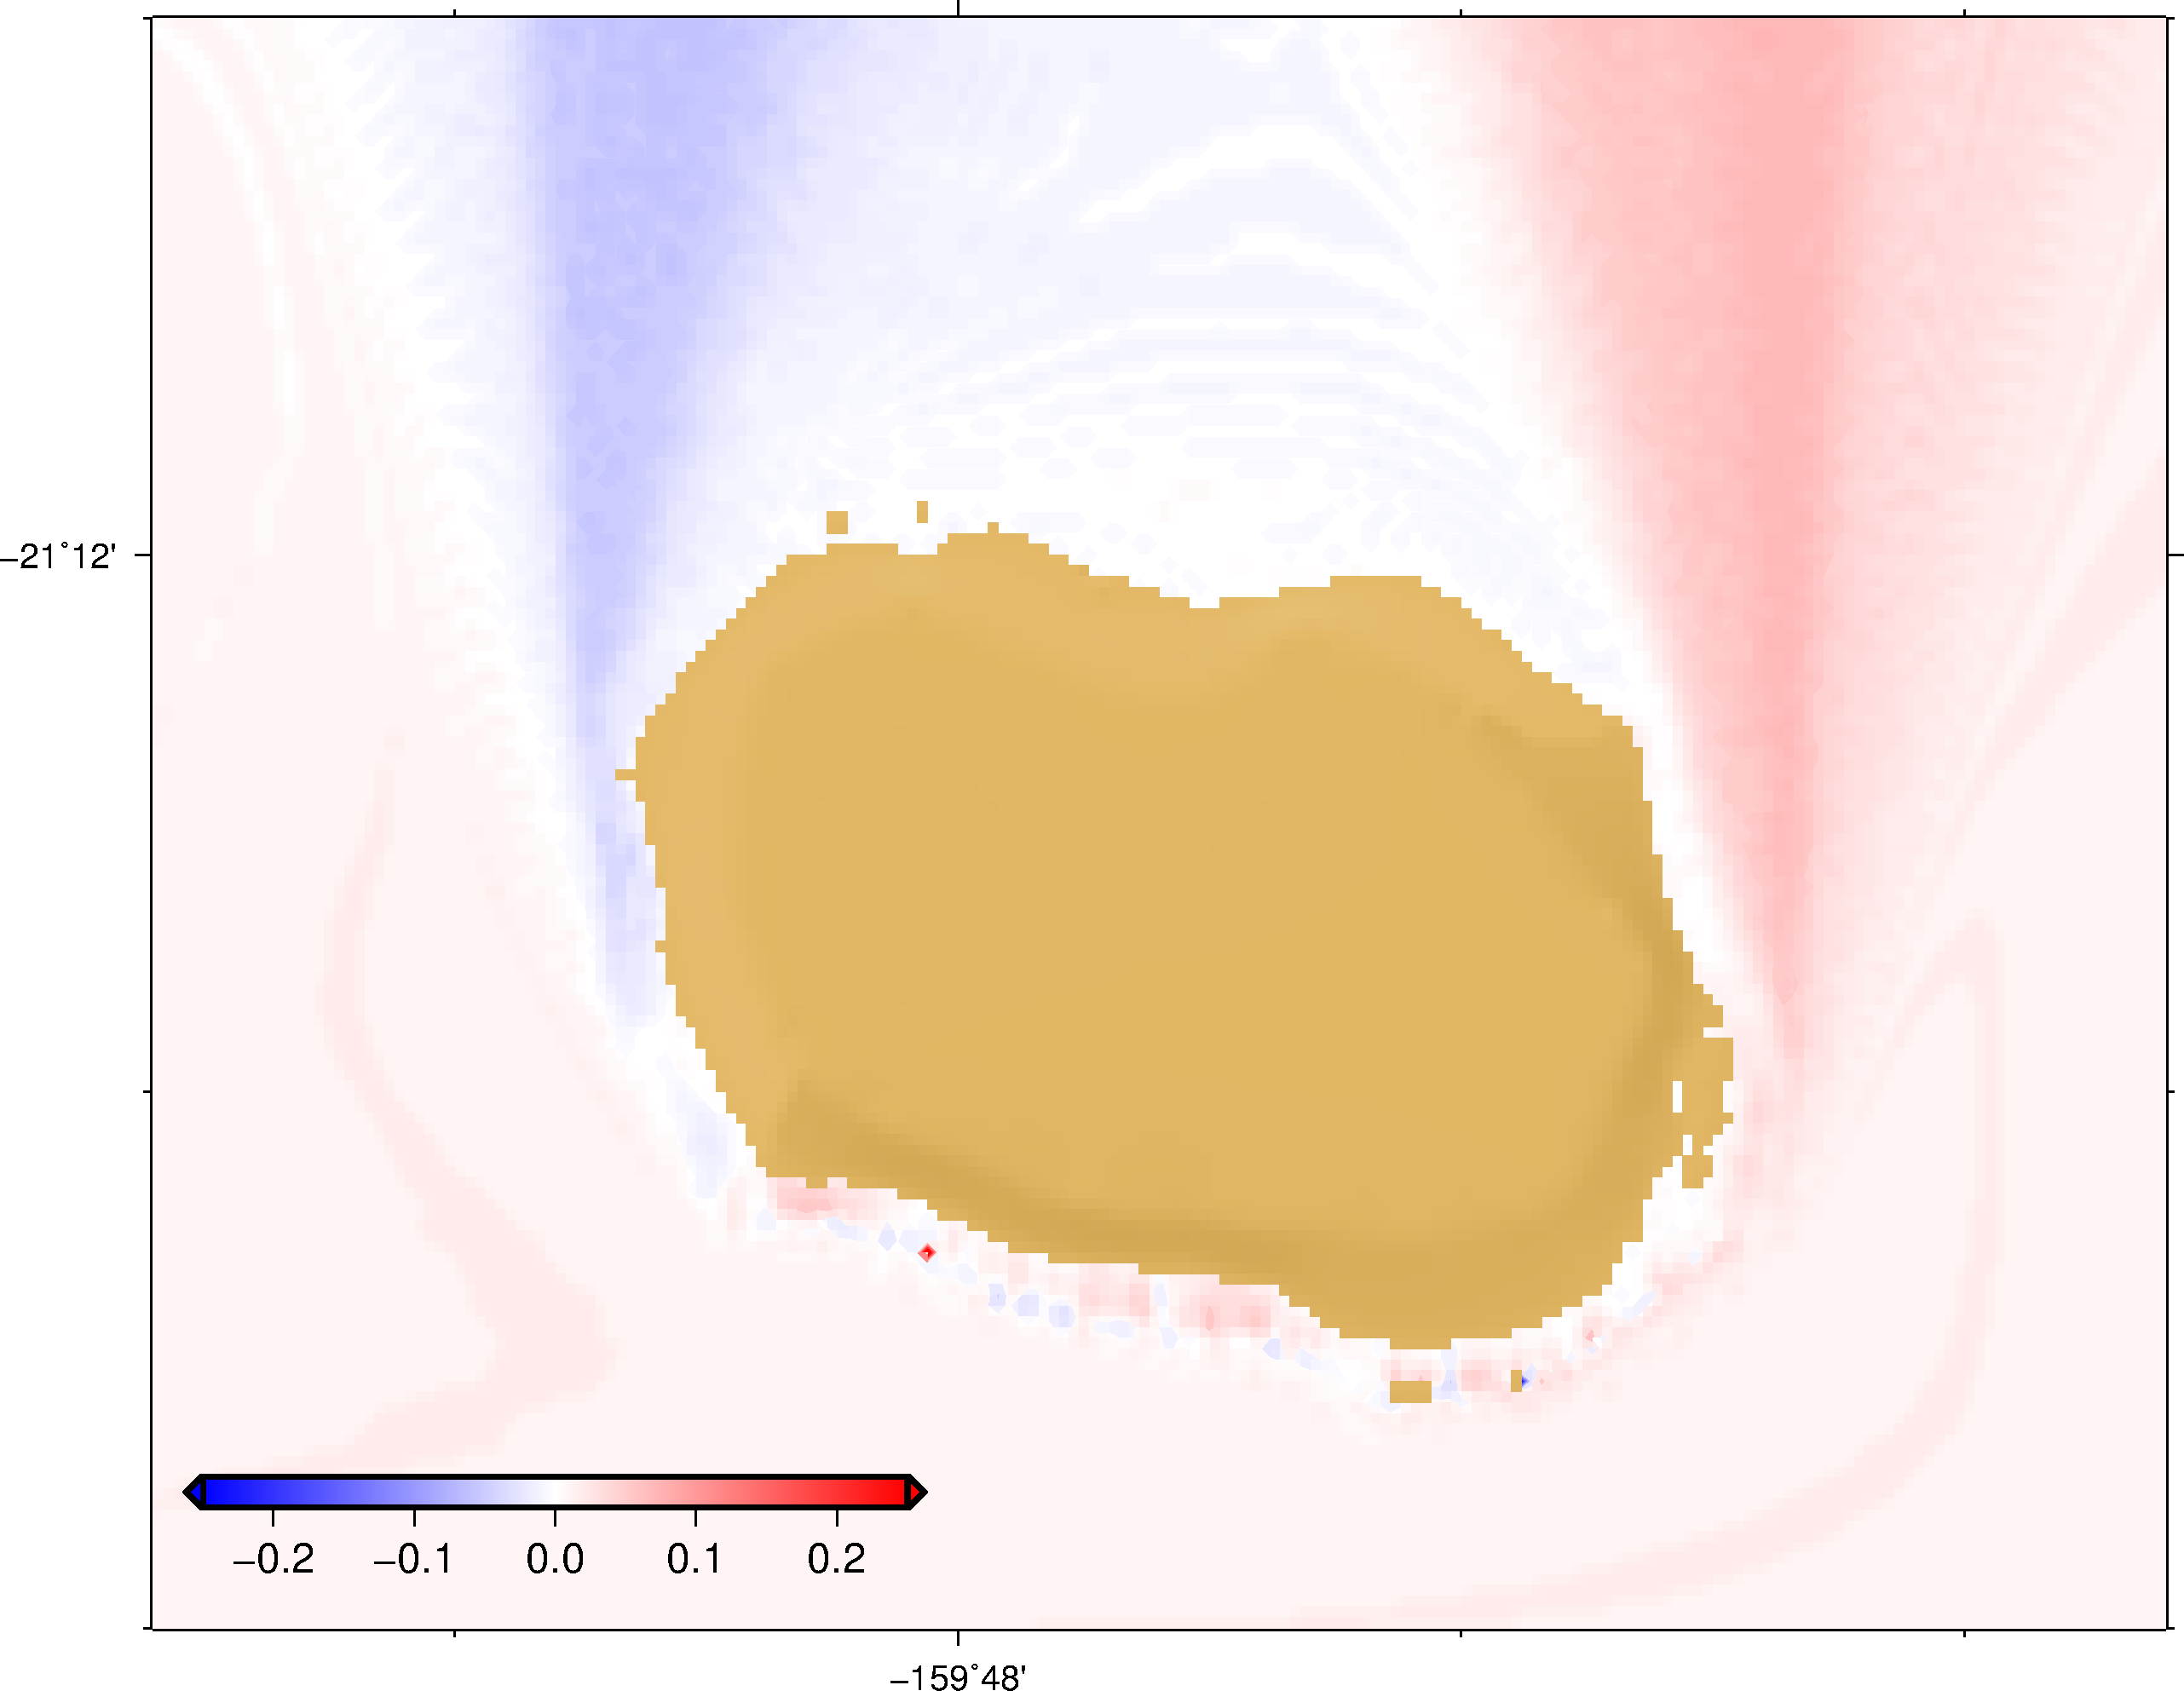
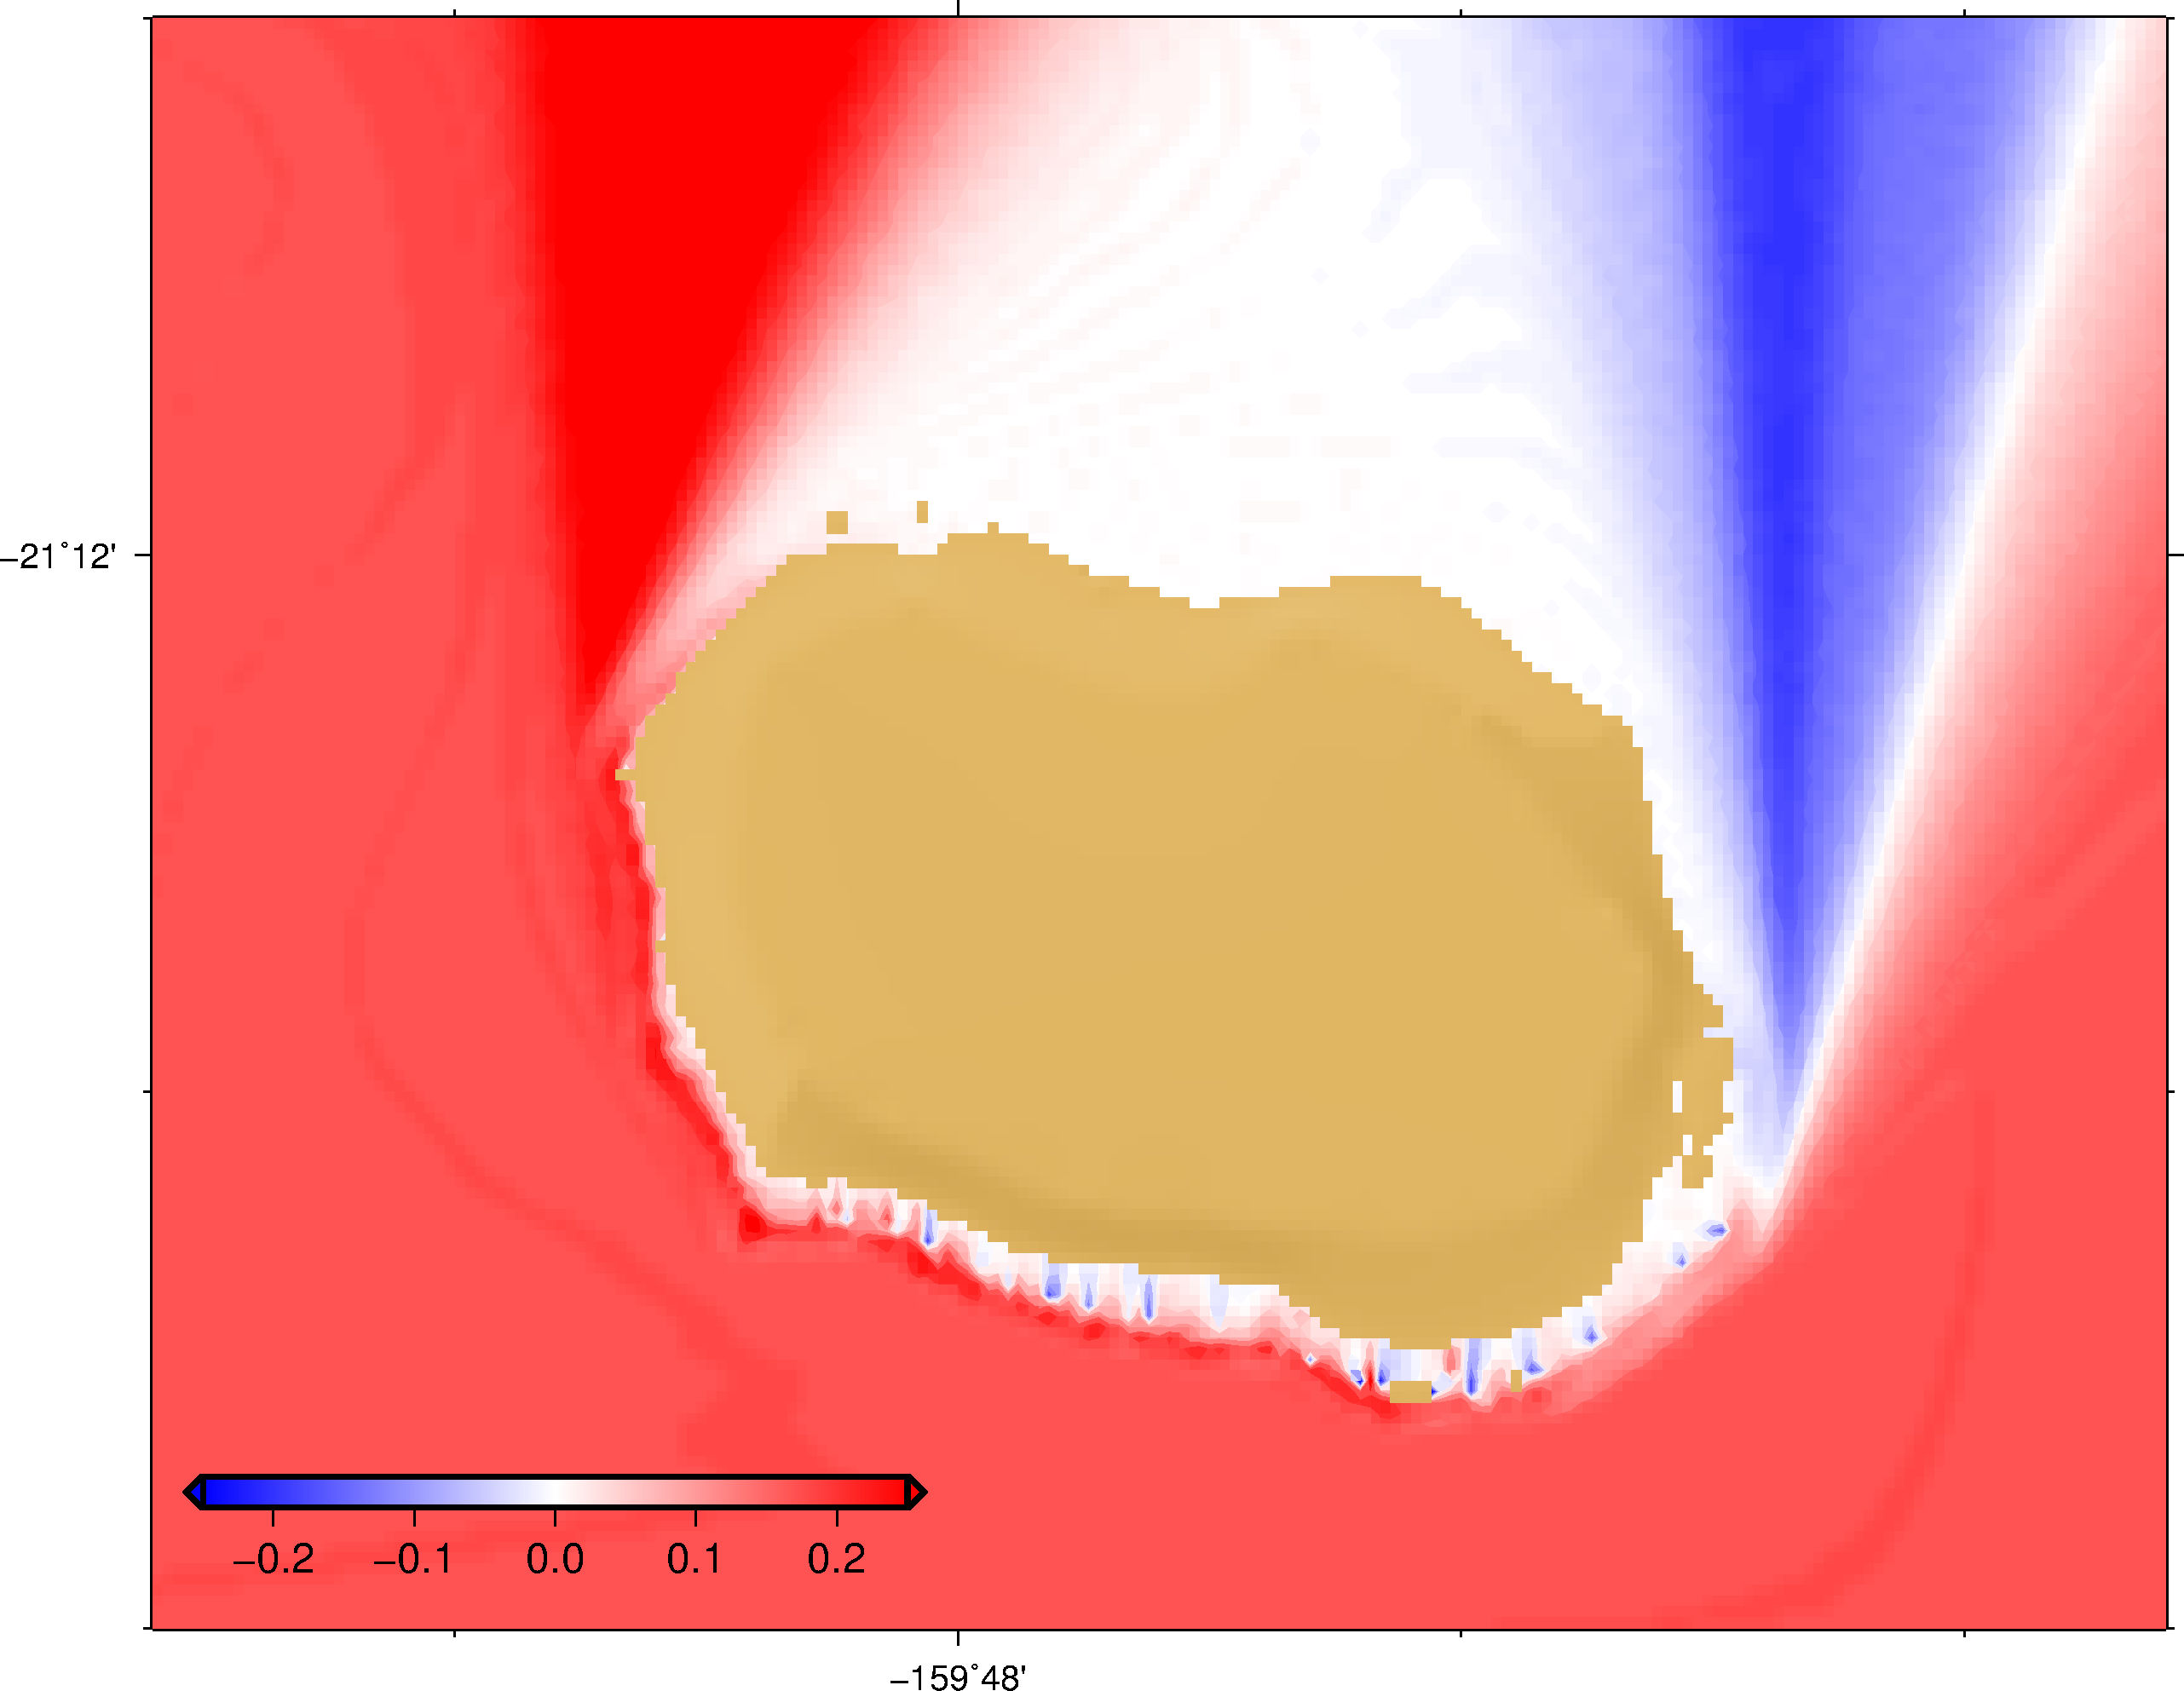
Mean Significant wave height (Hs) changes END21C RCP8.5
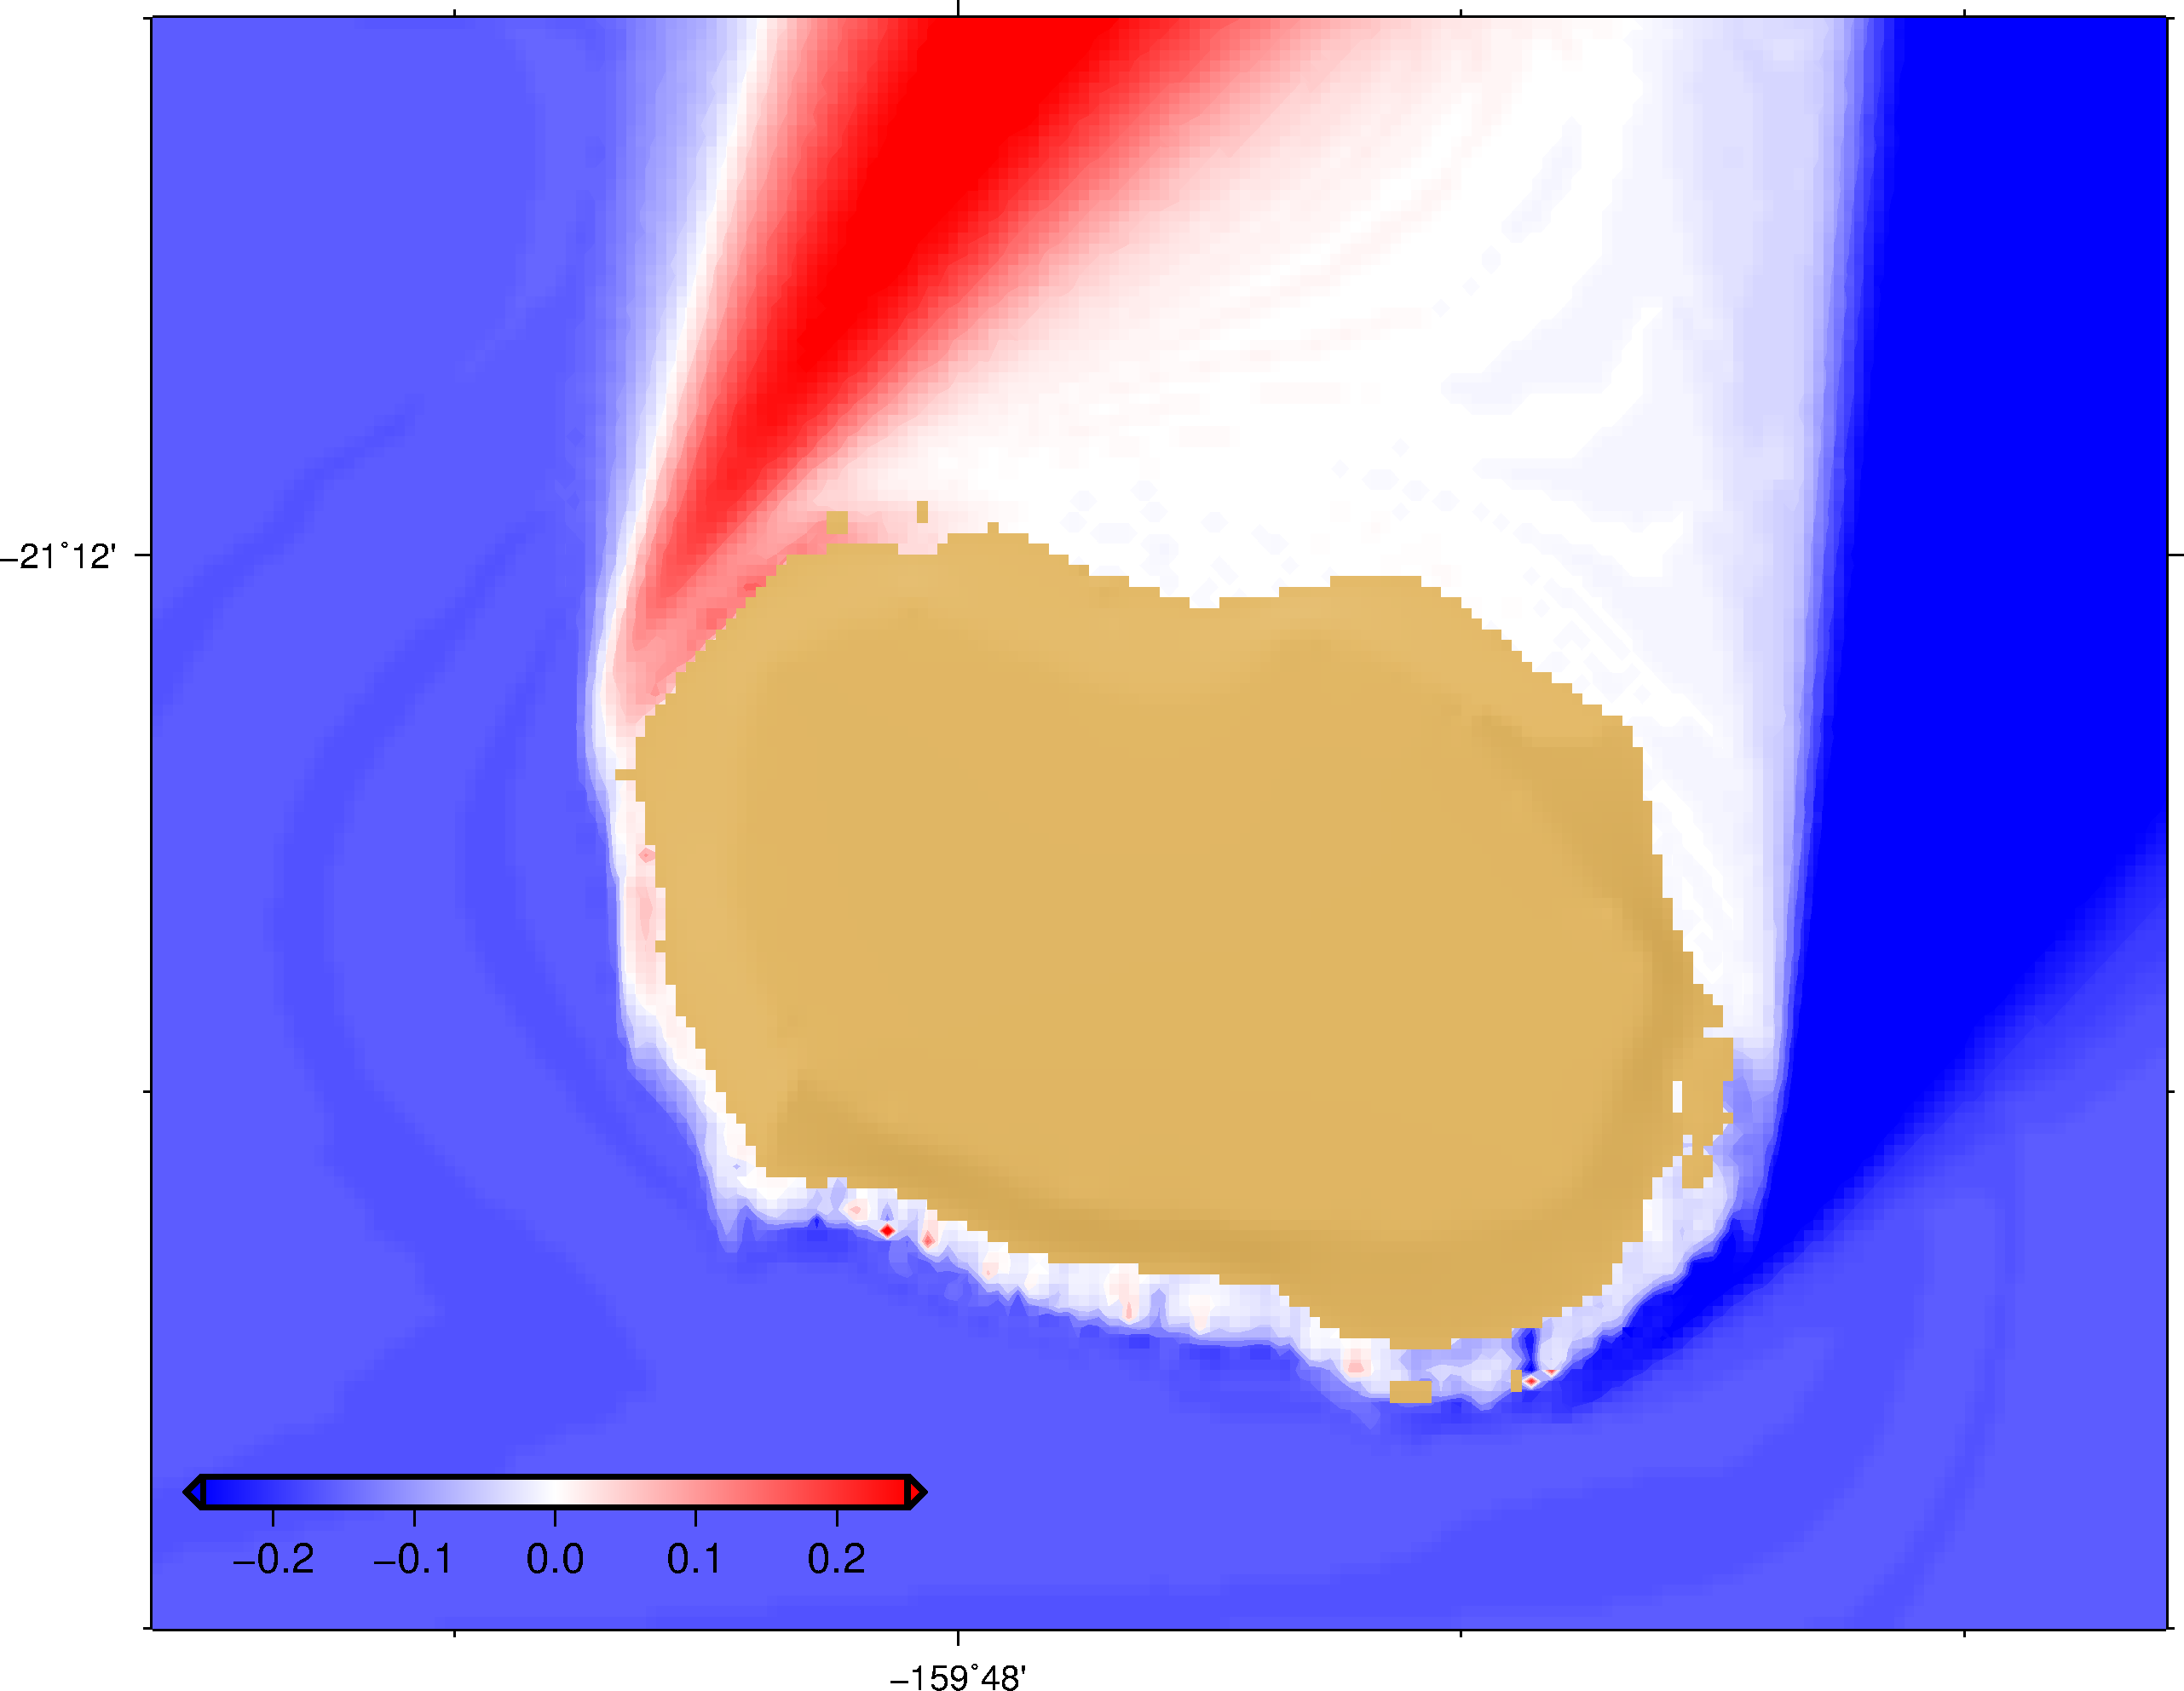
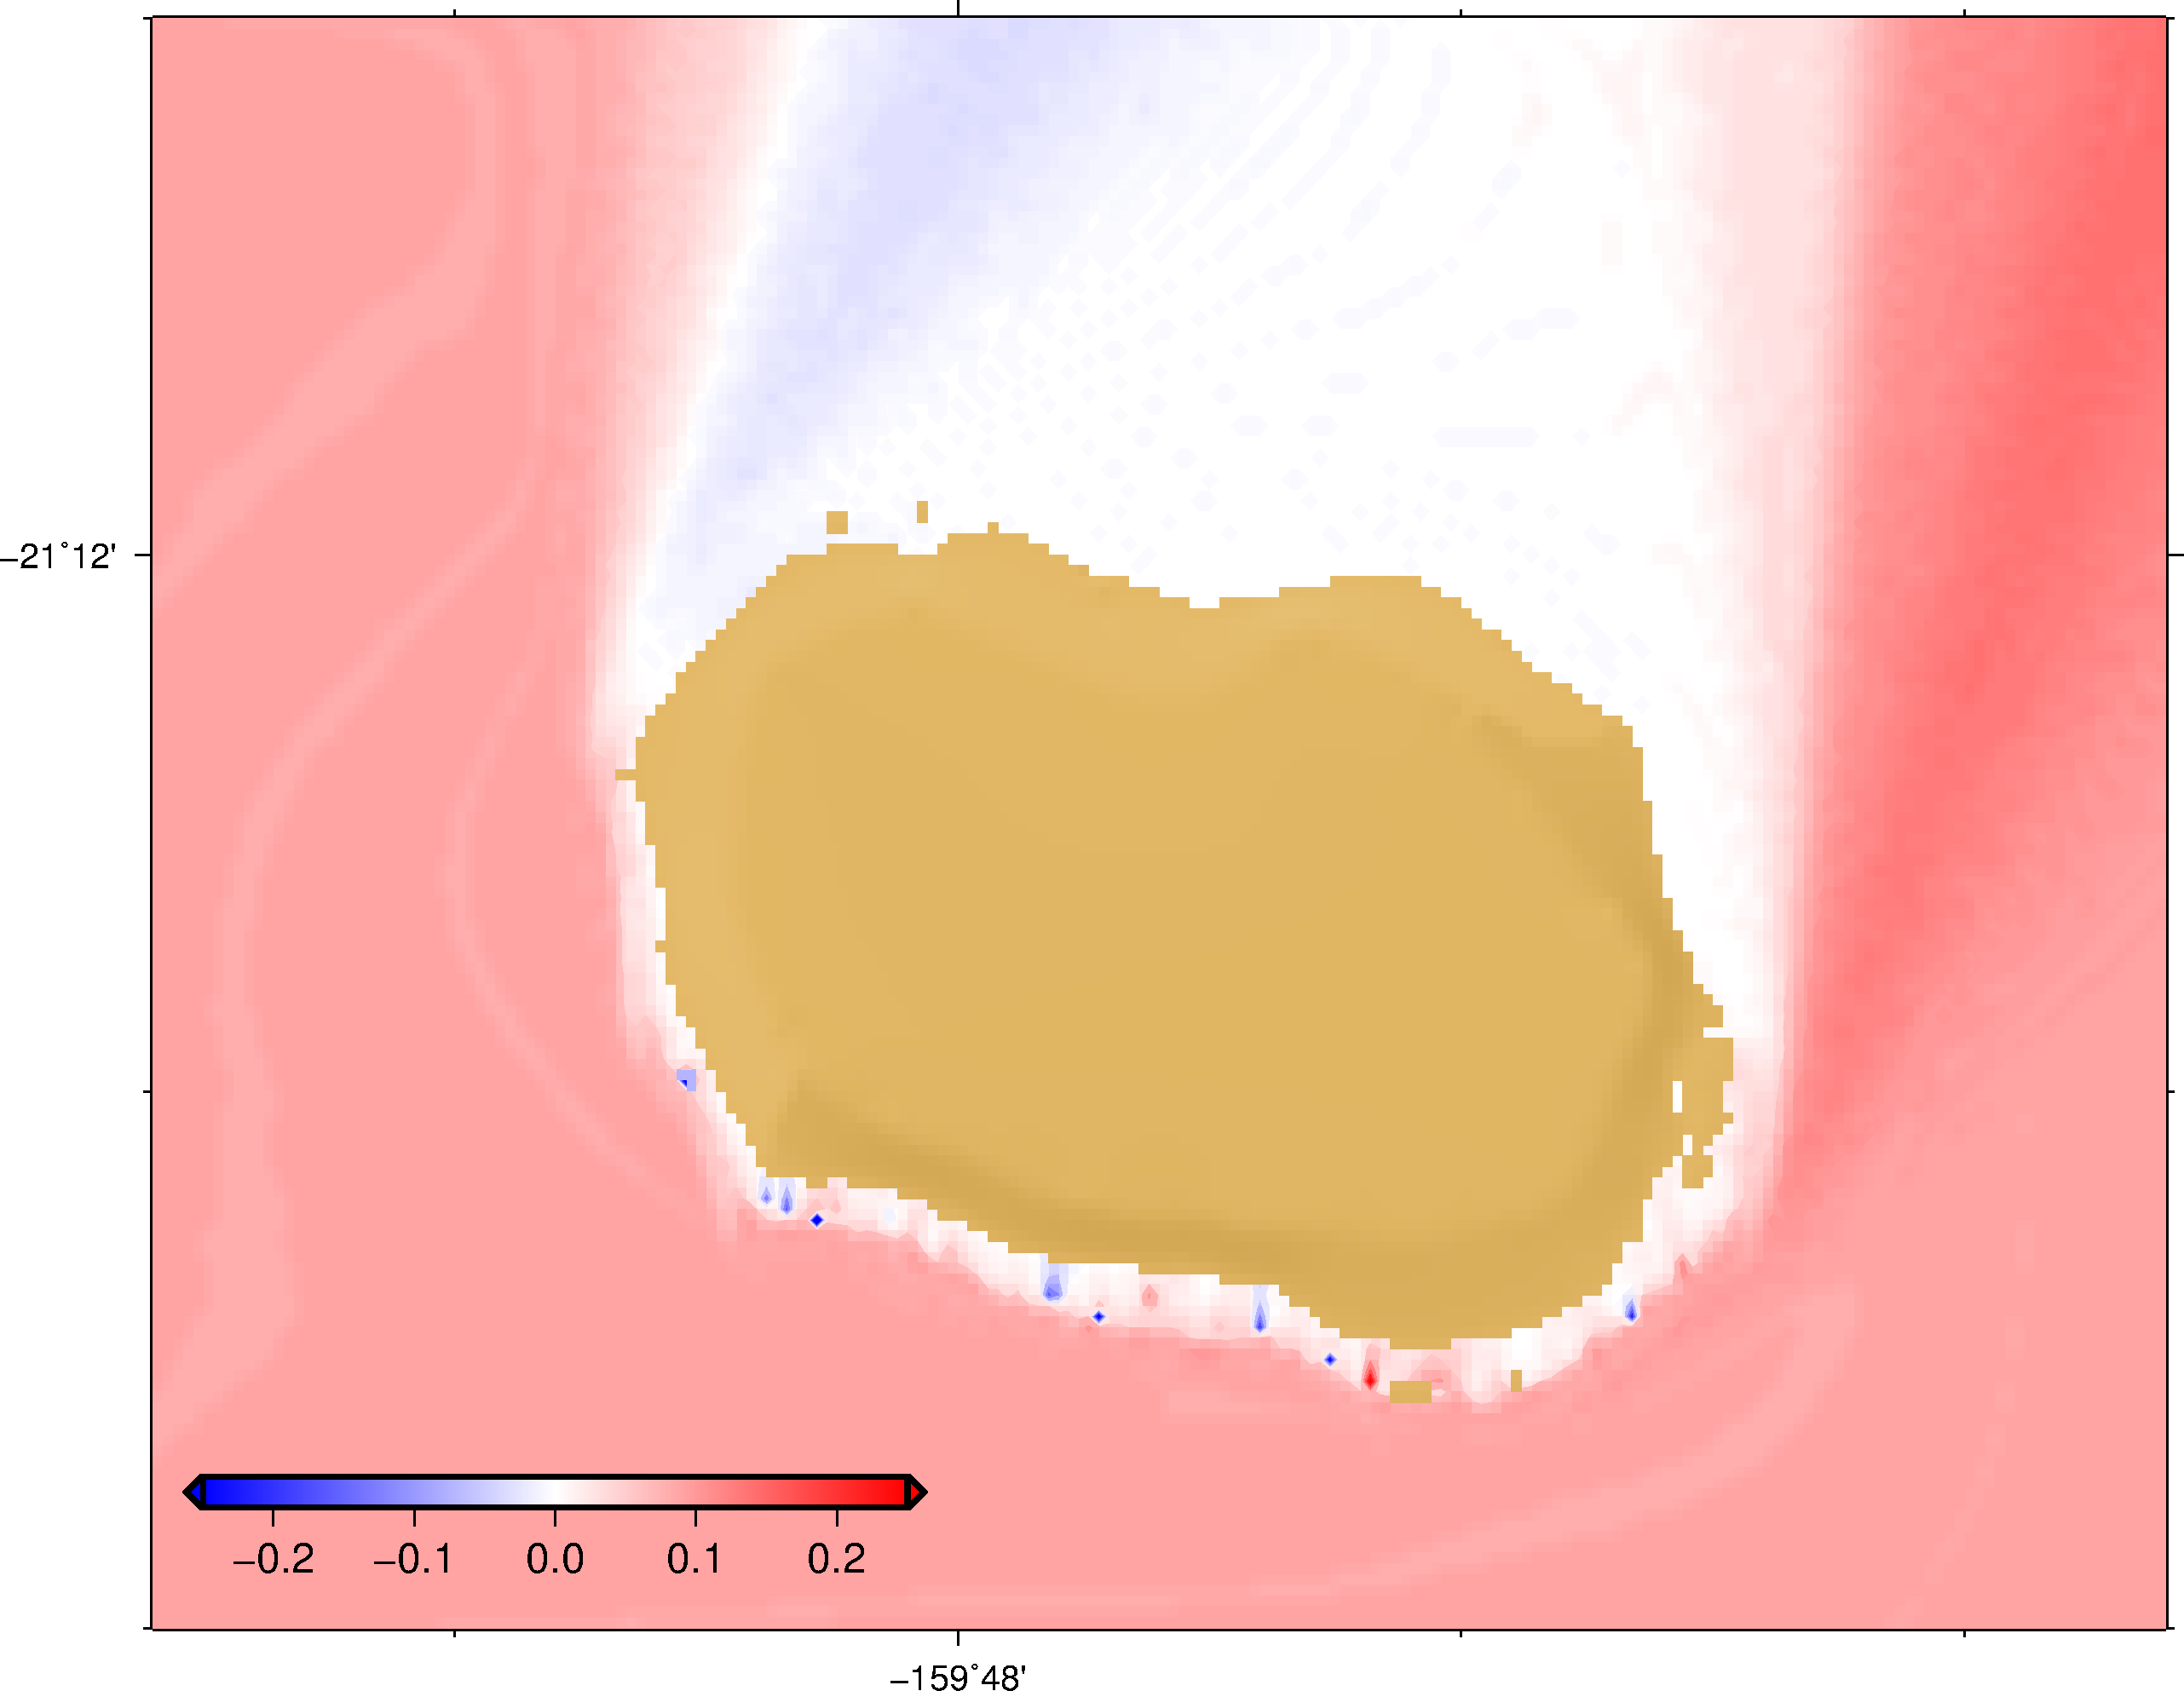
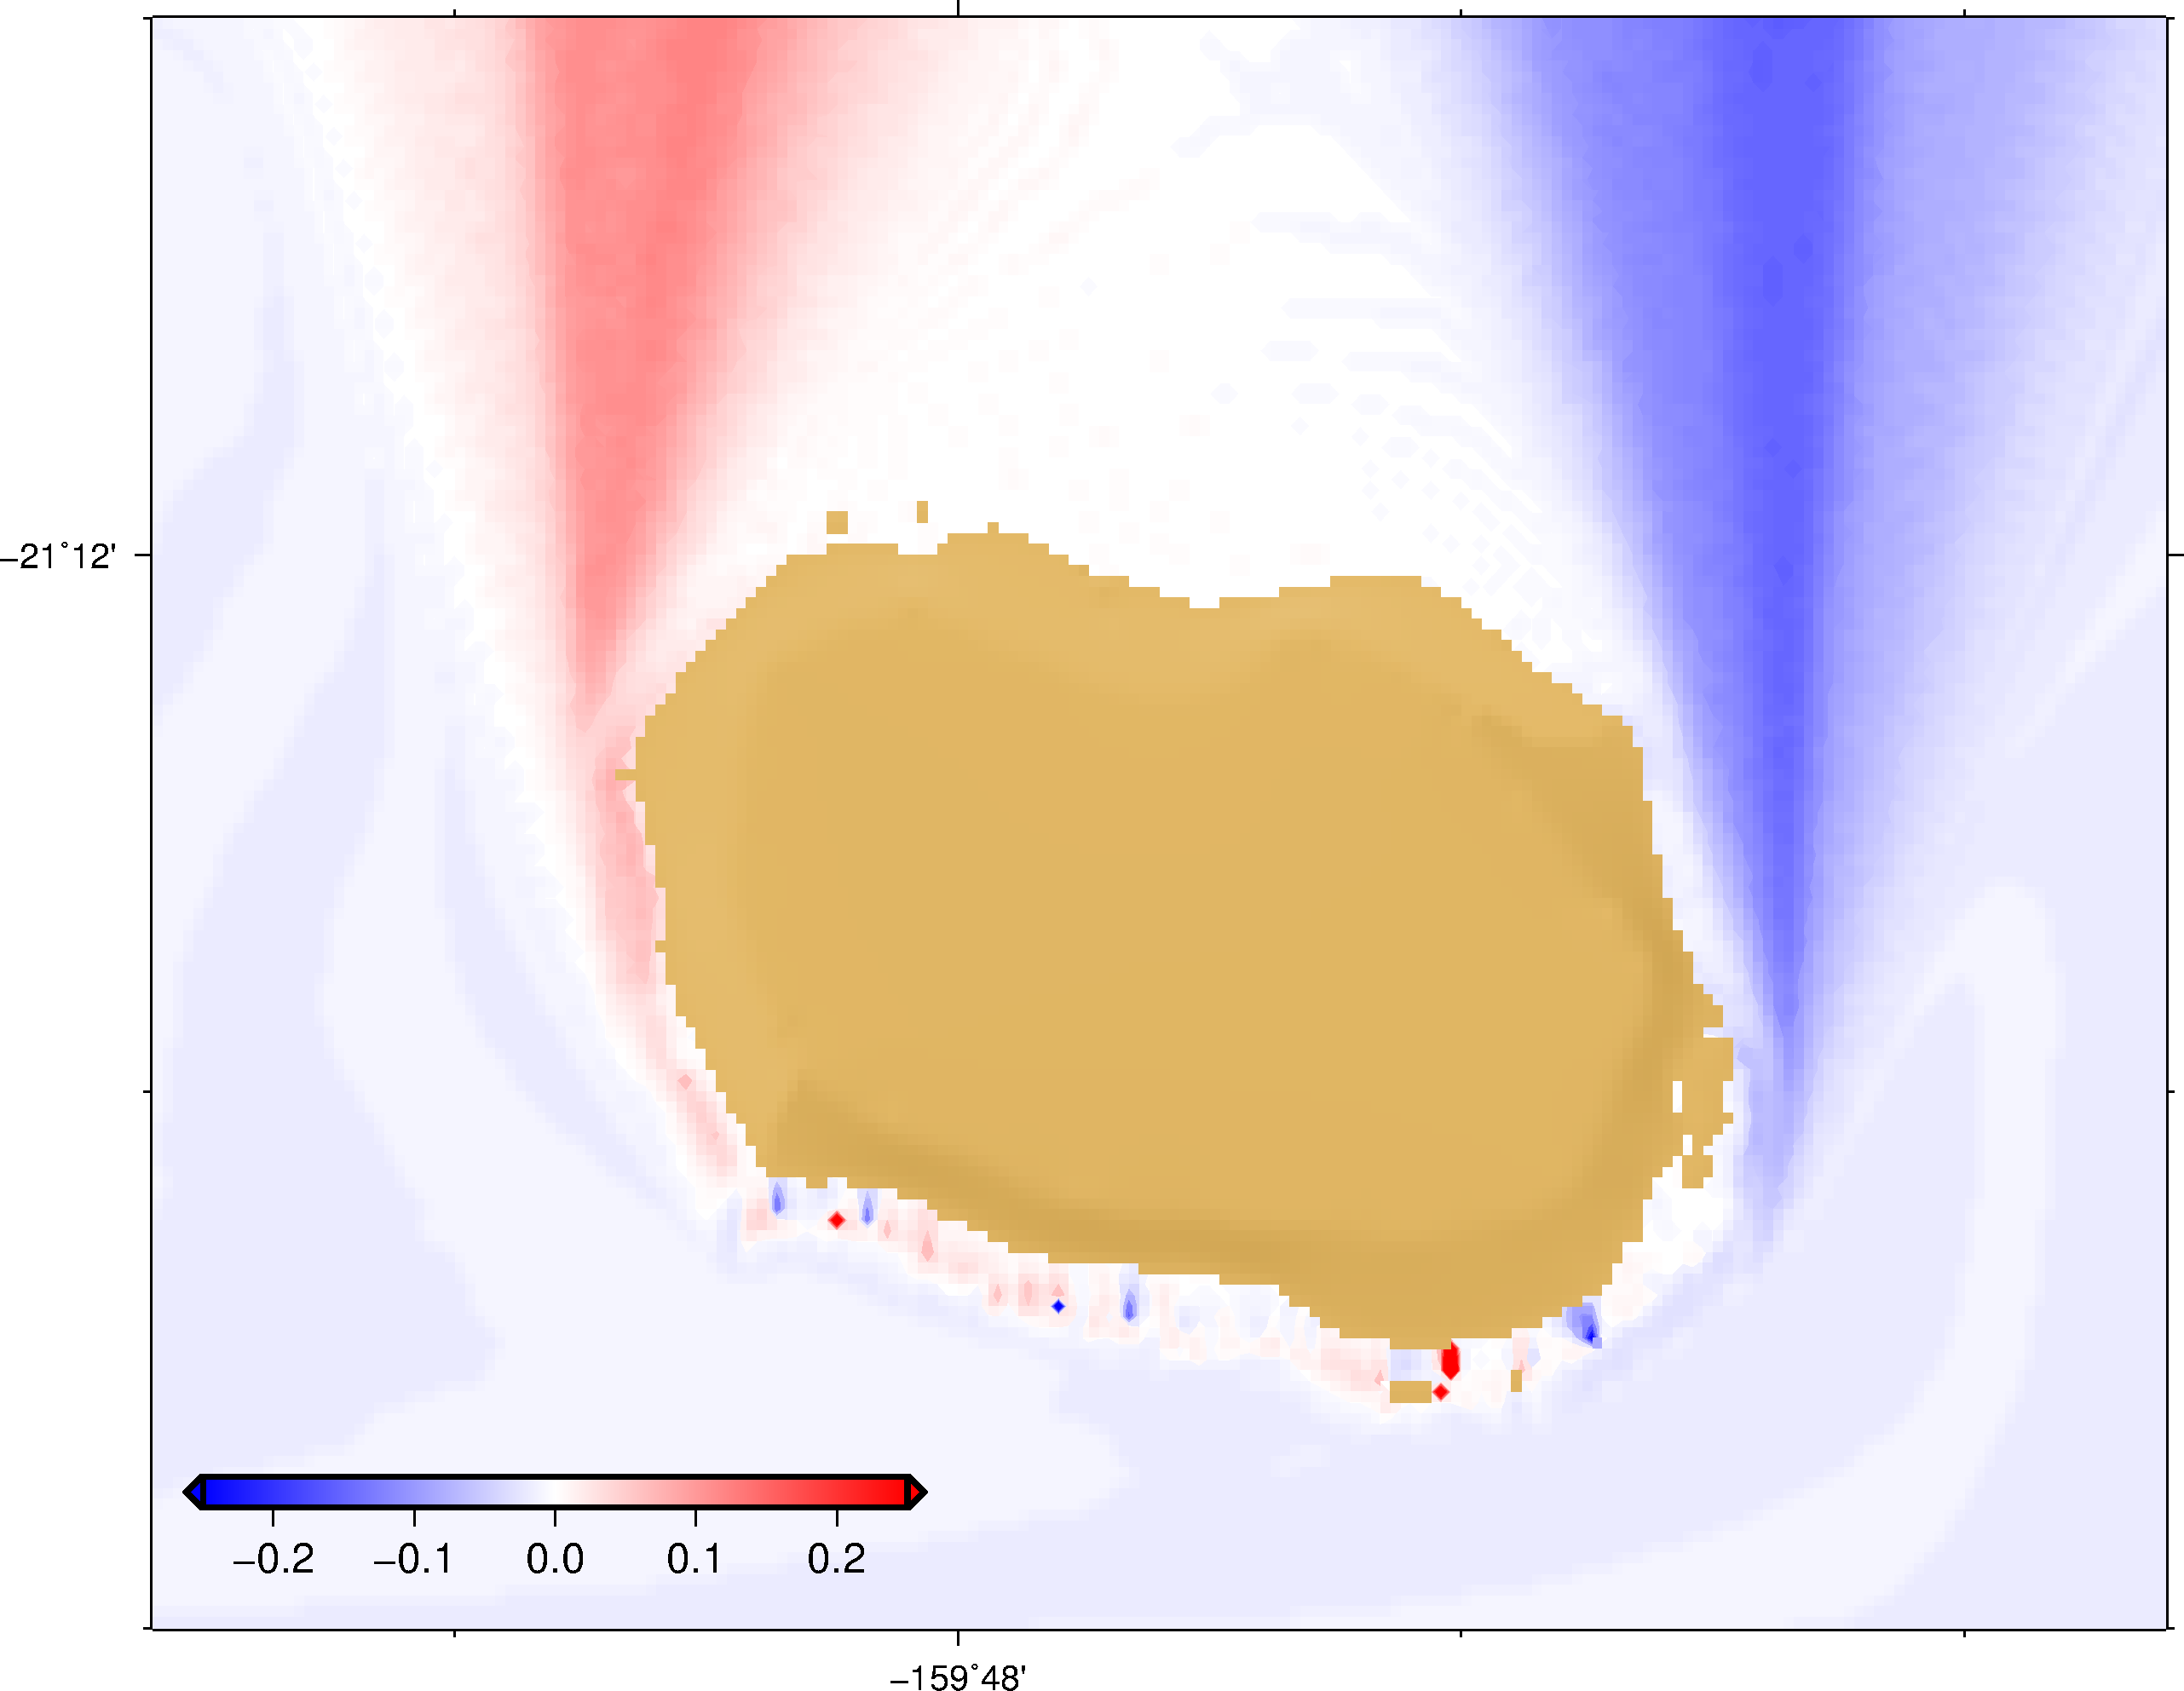
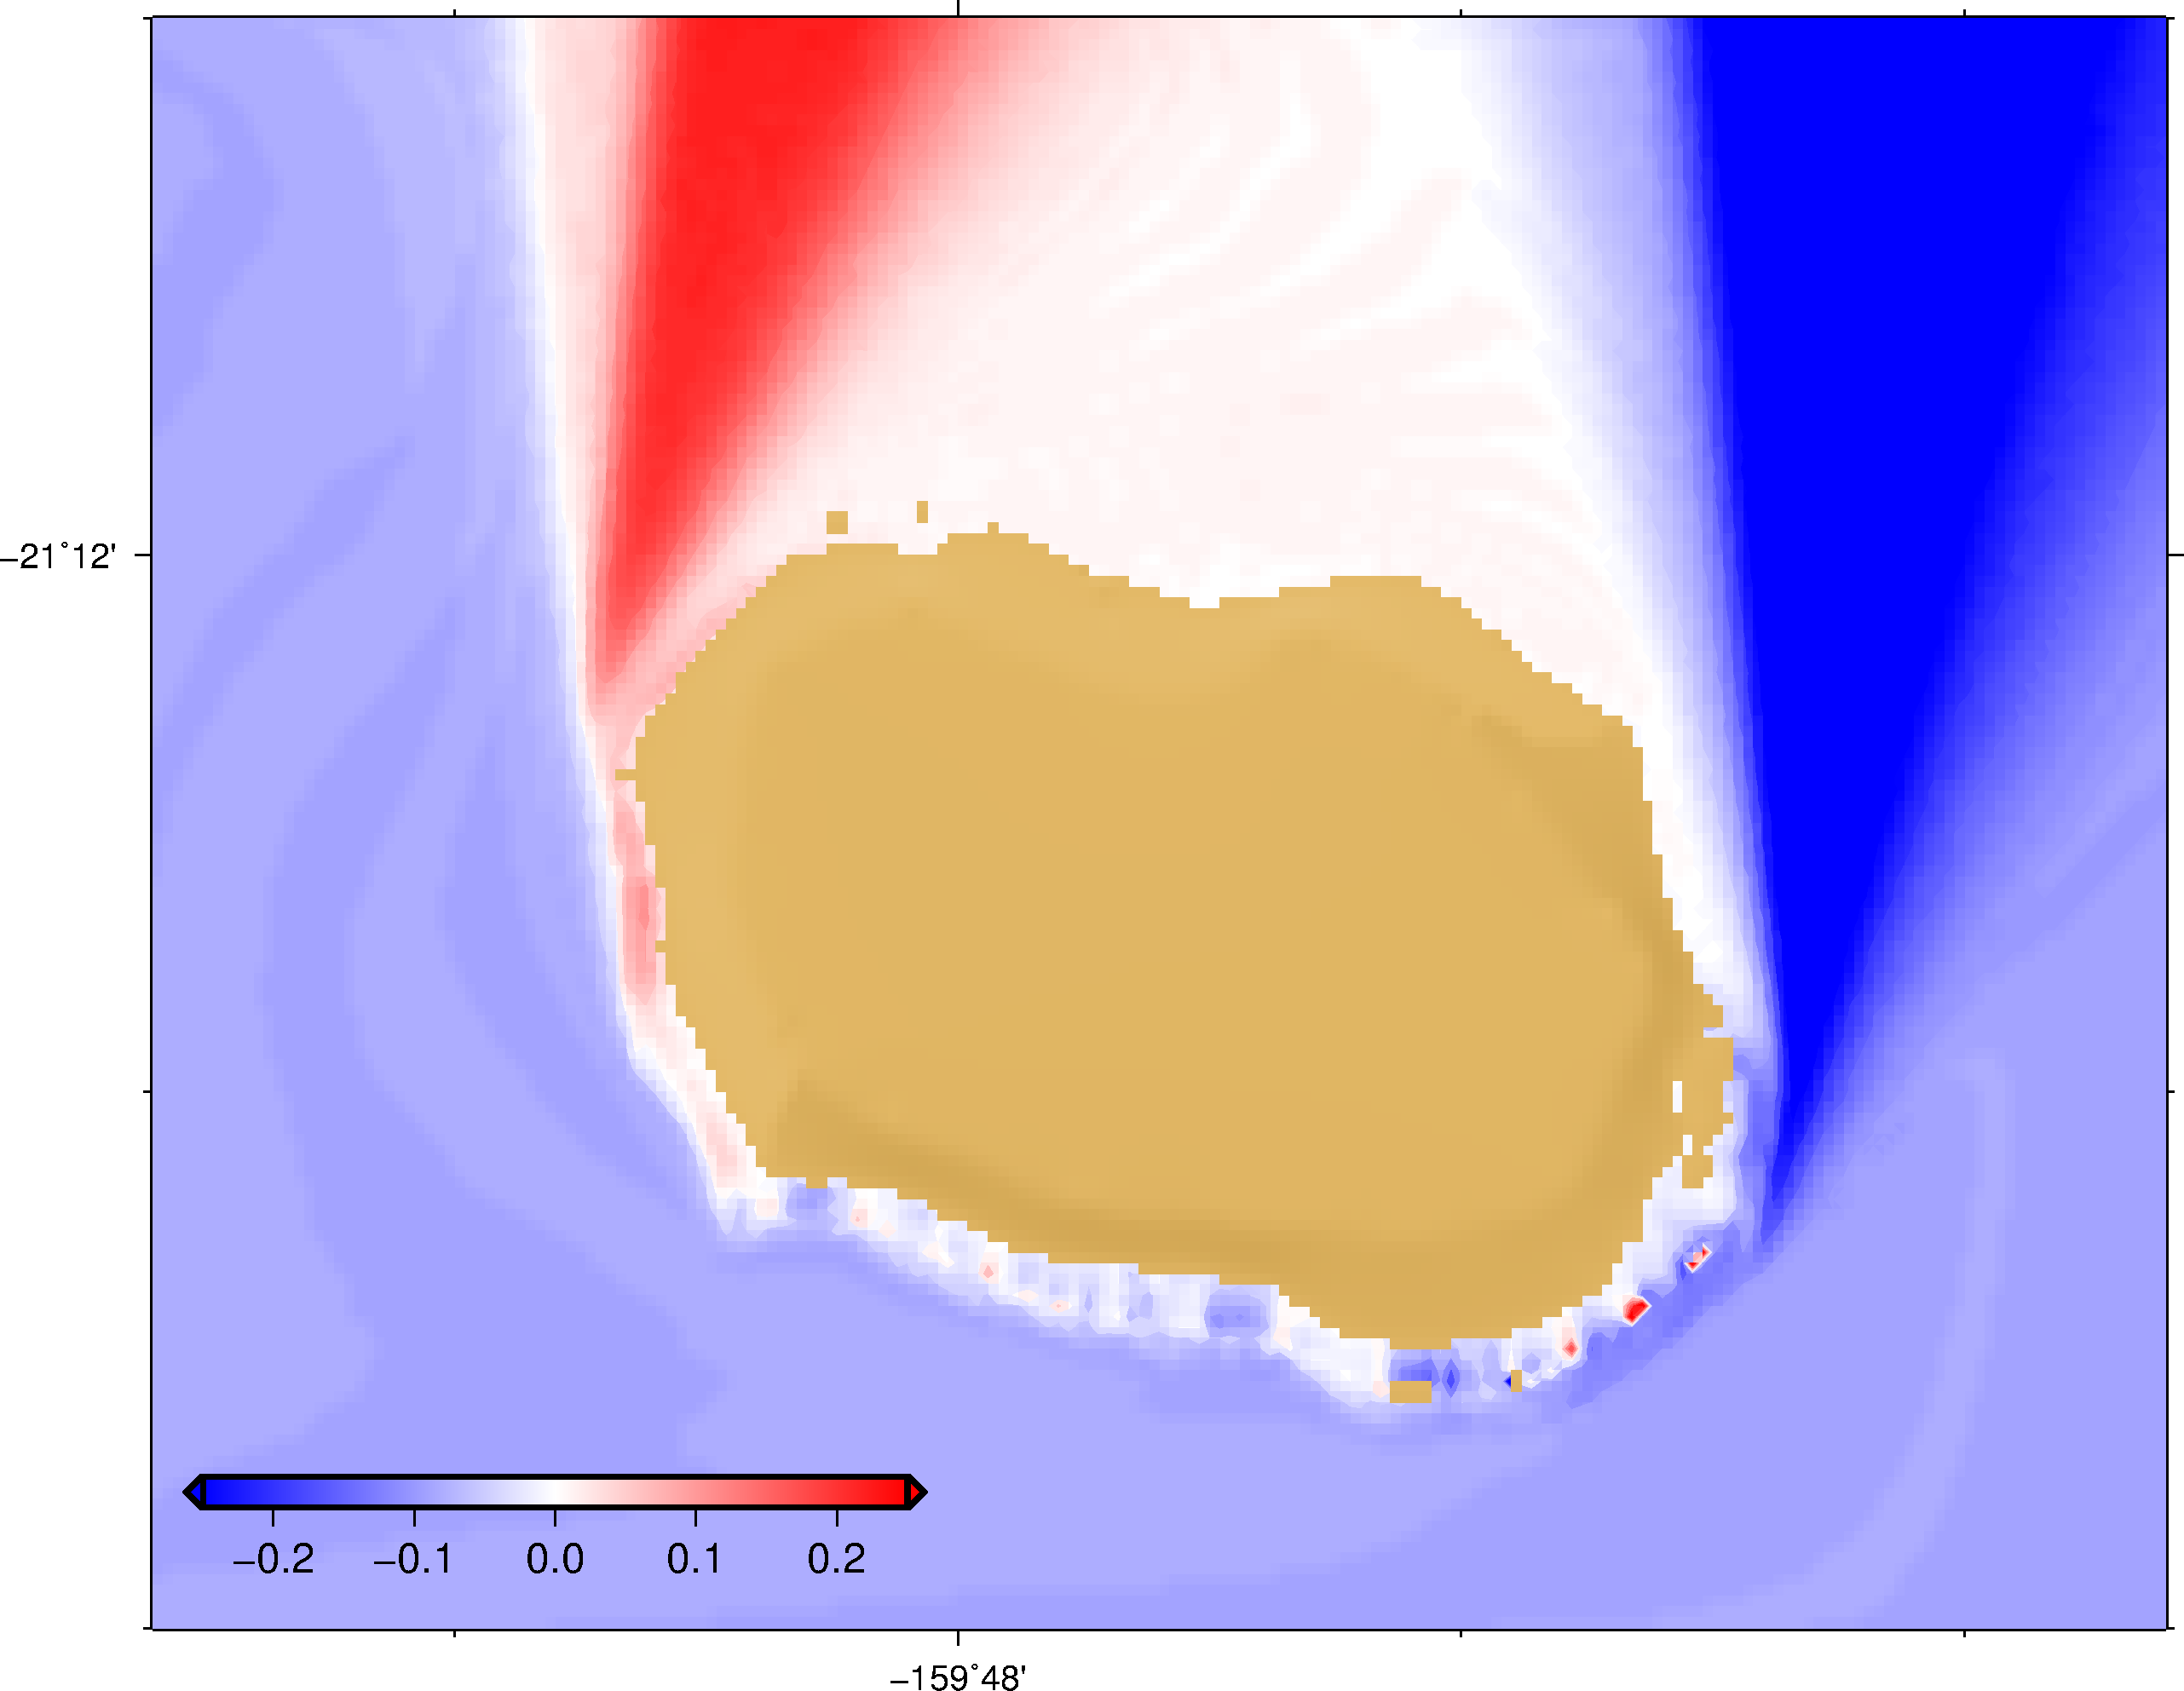
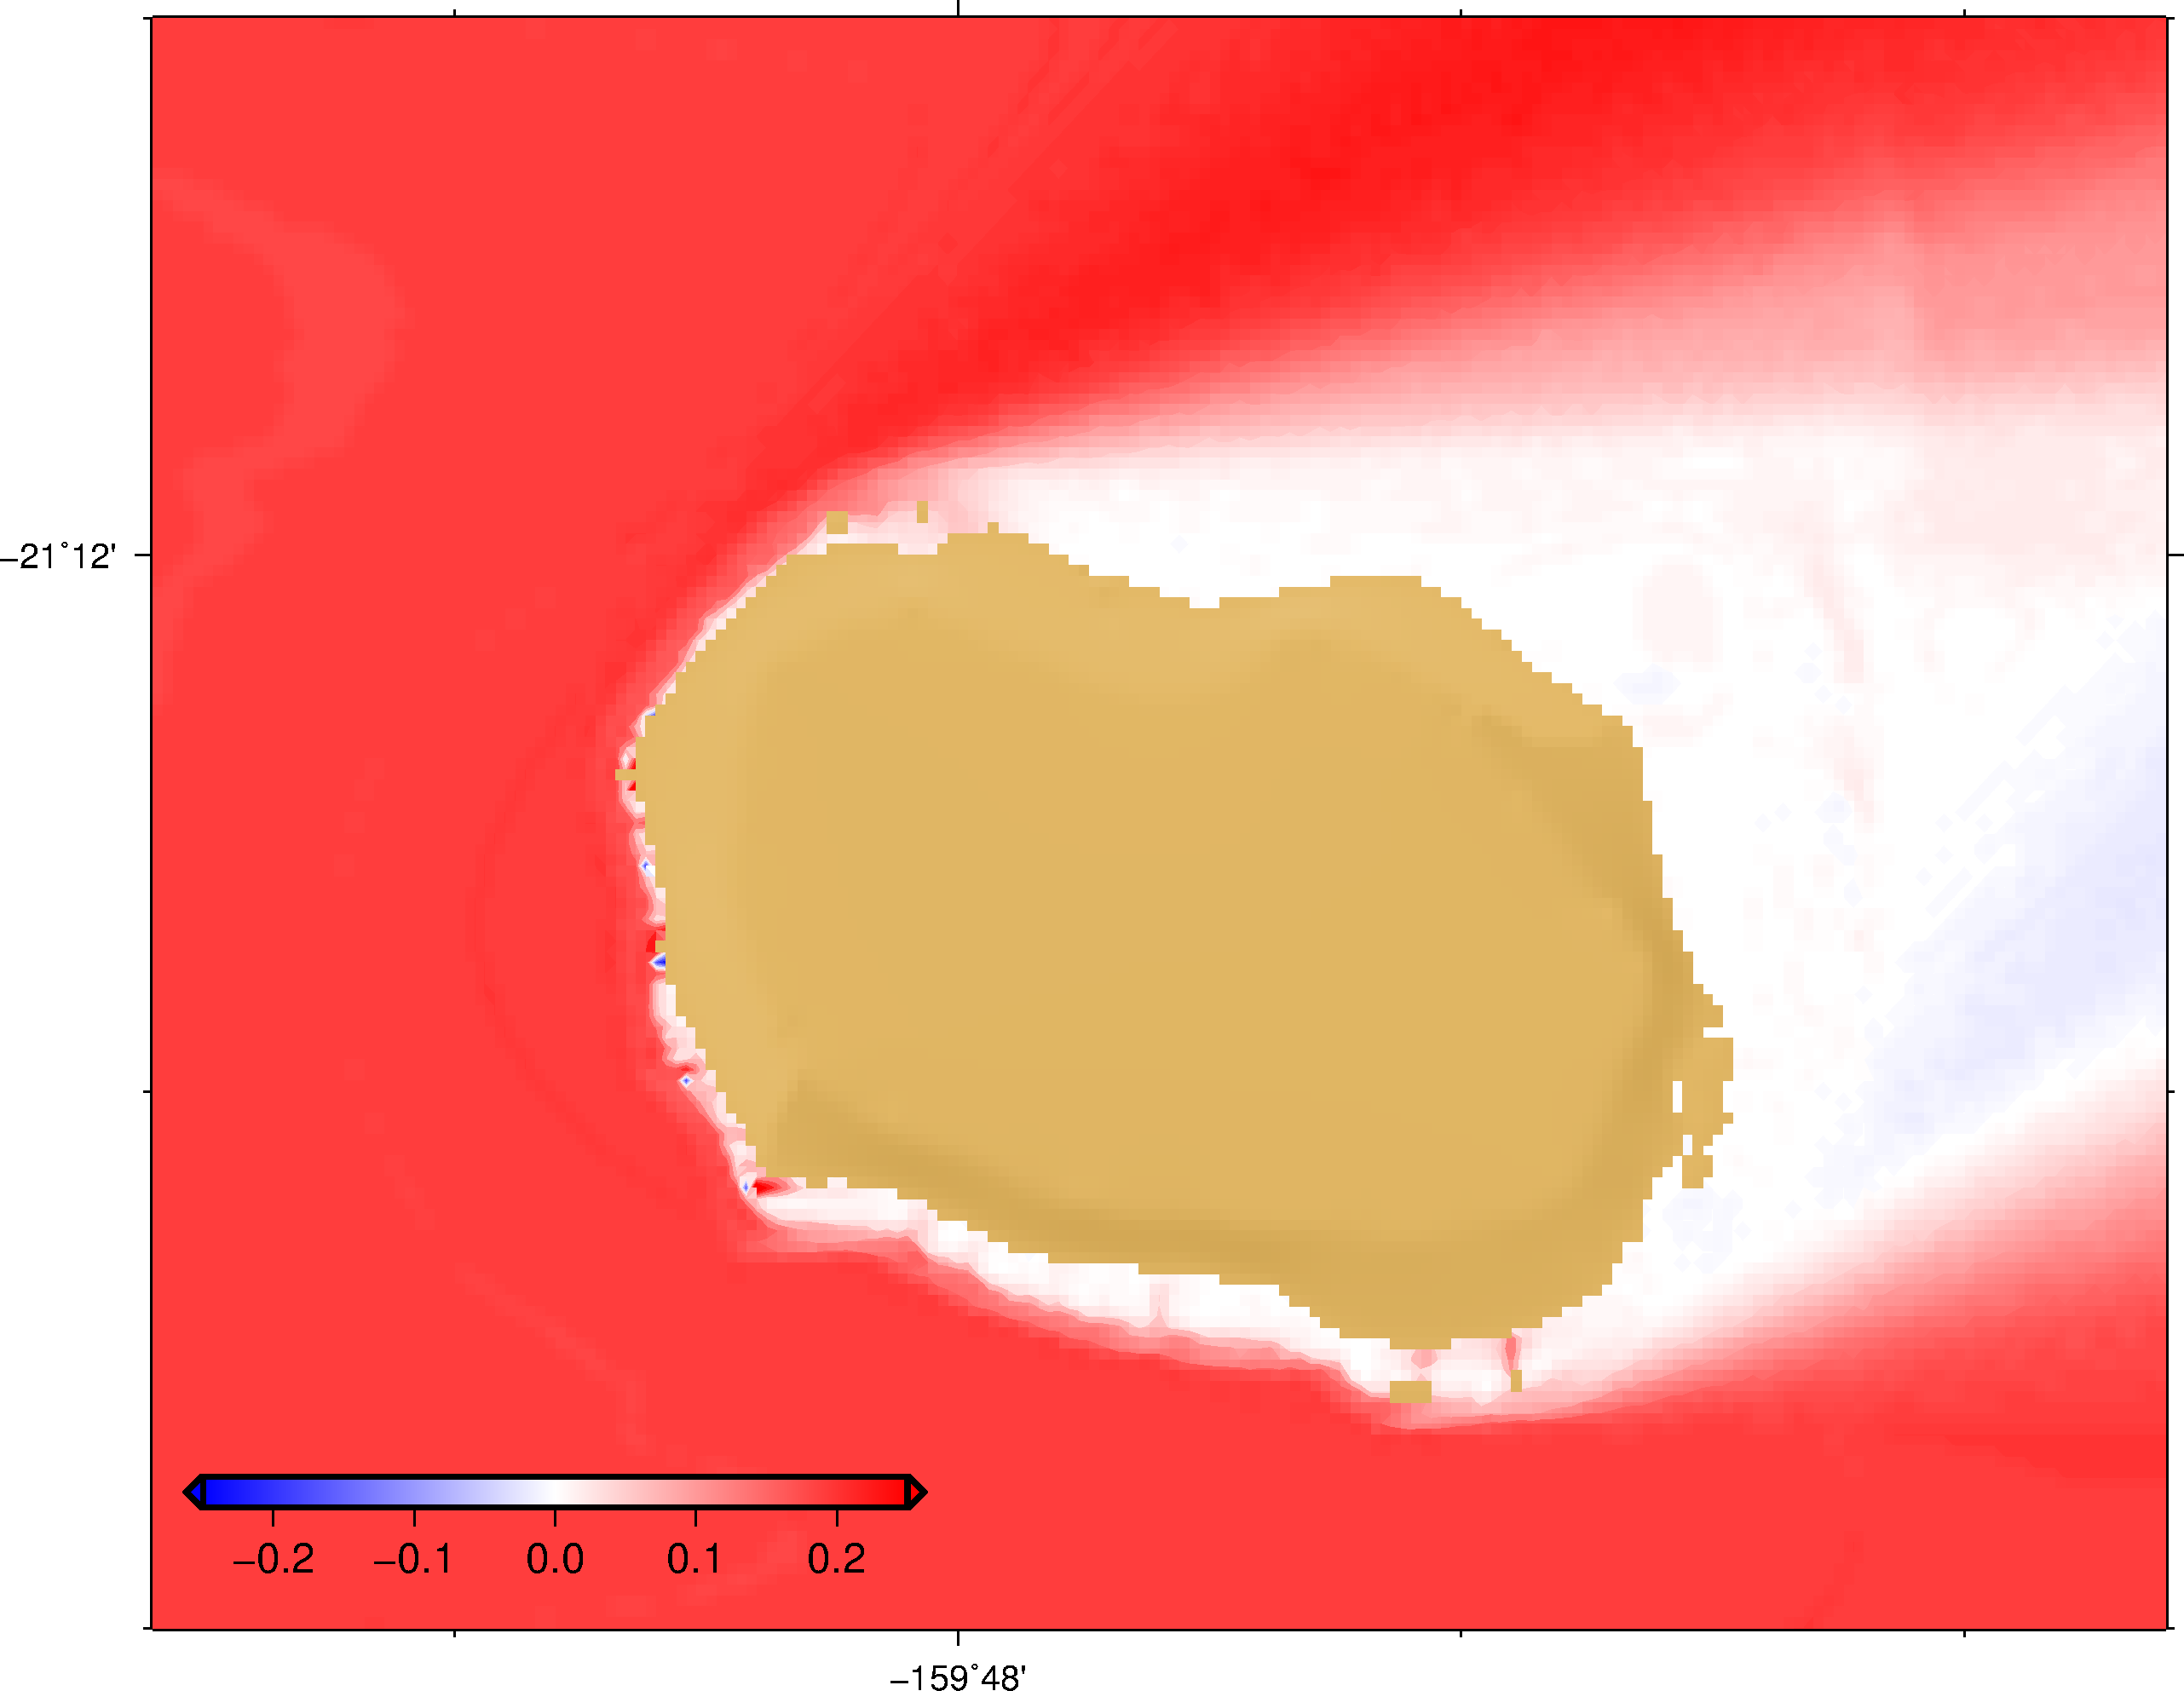
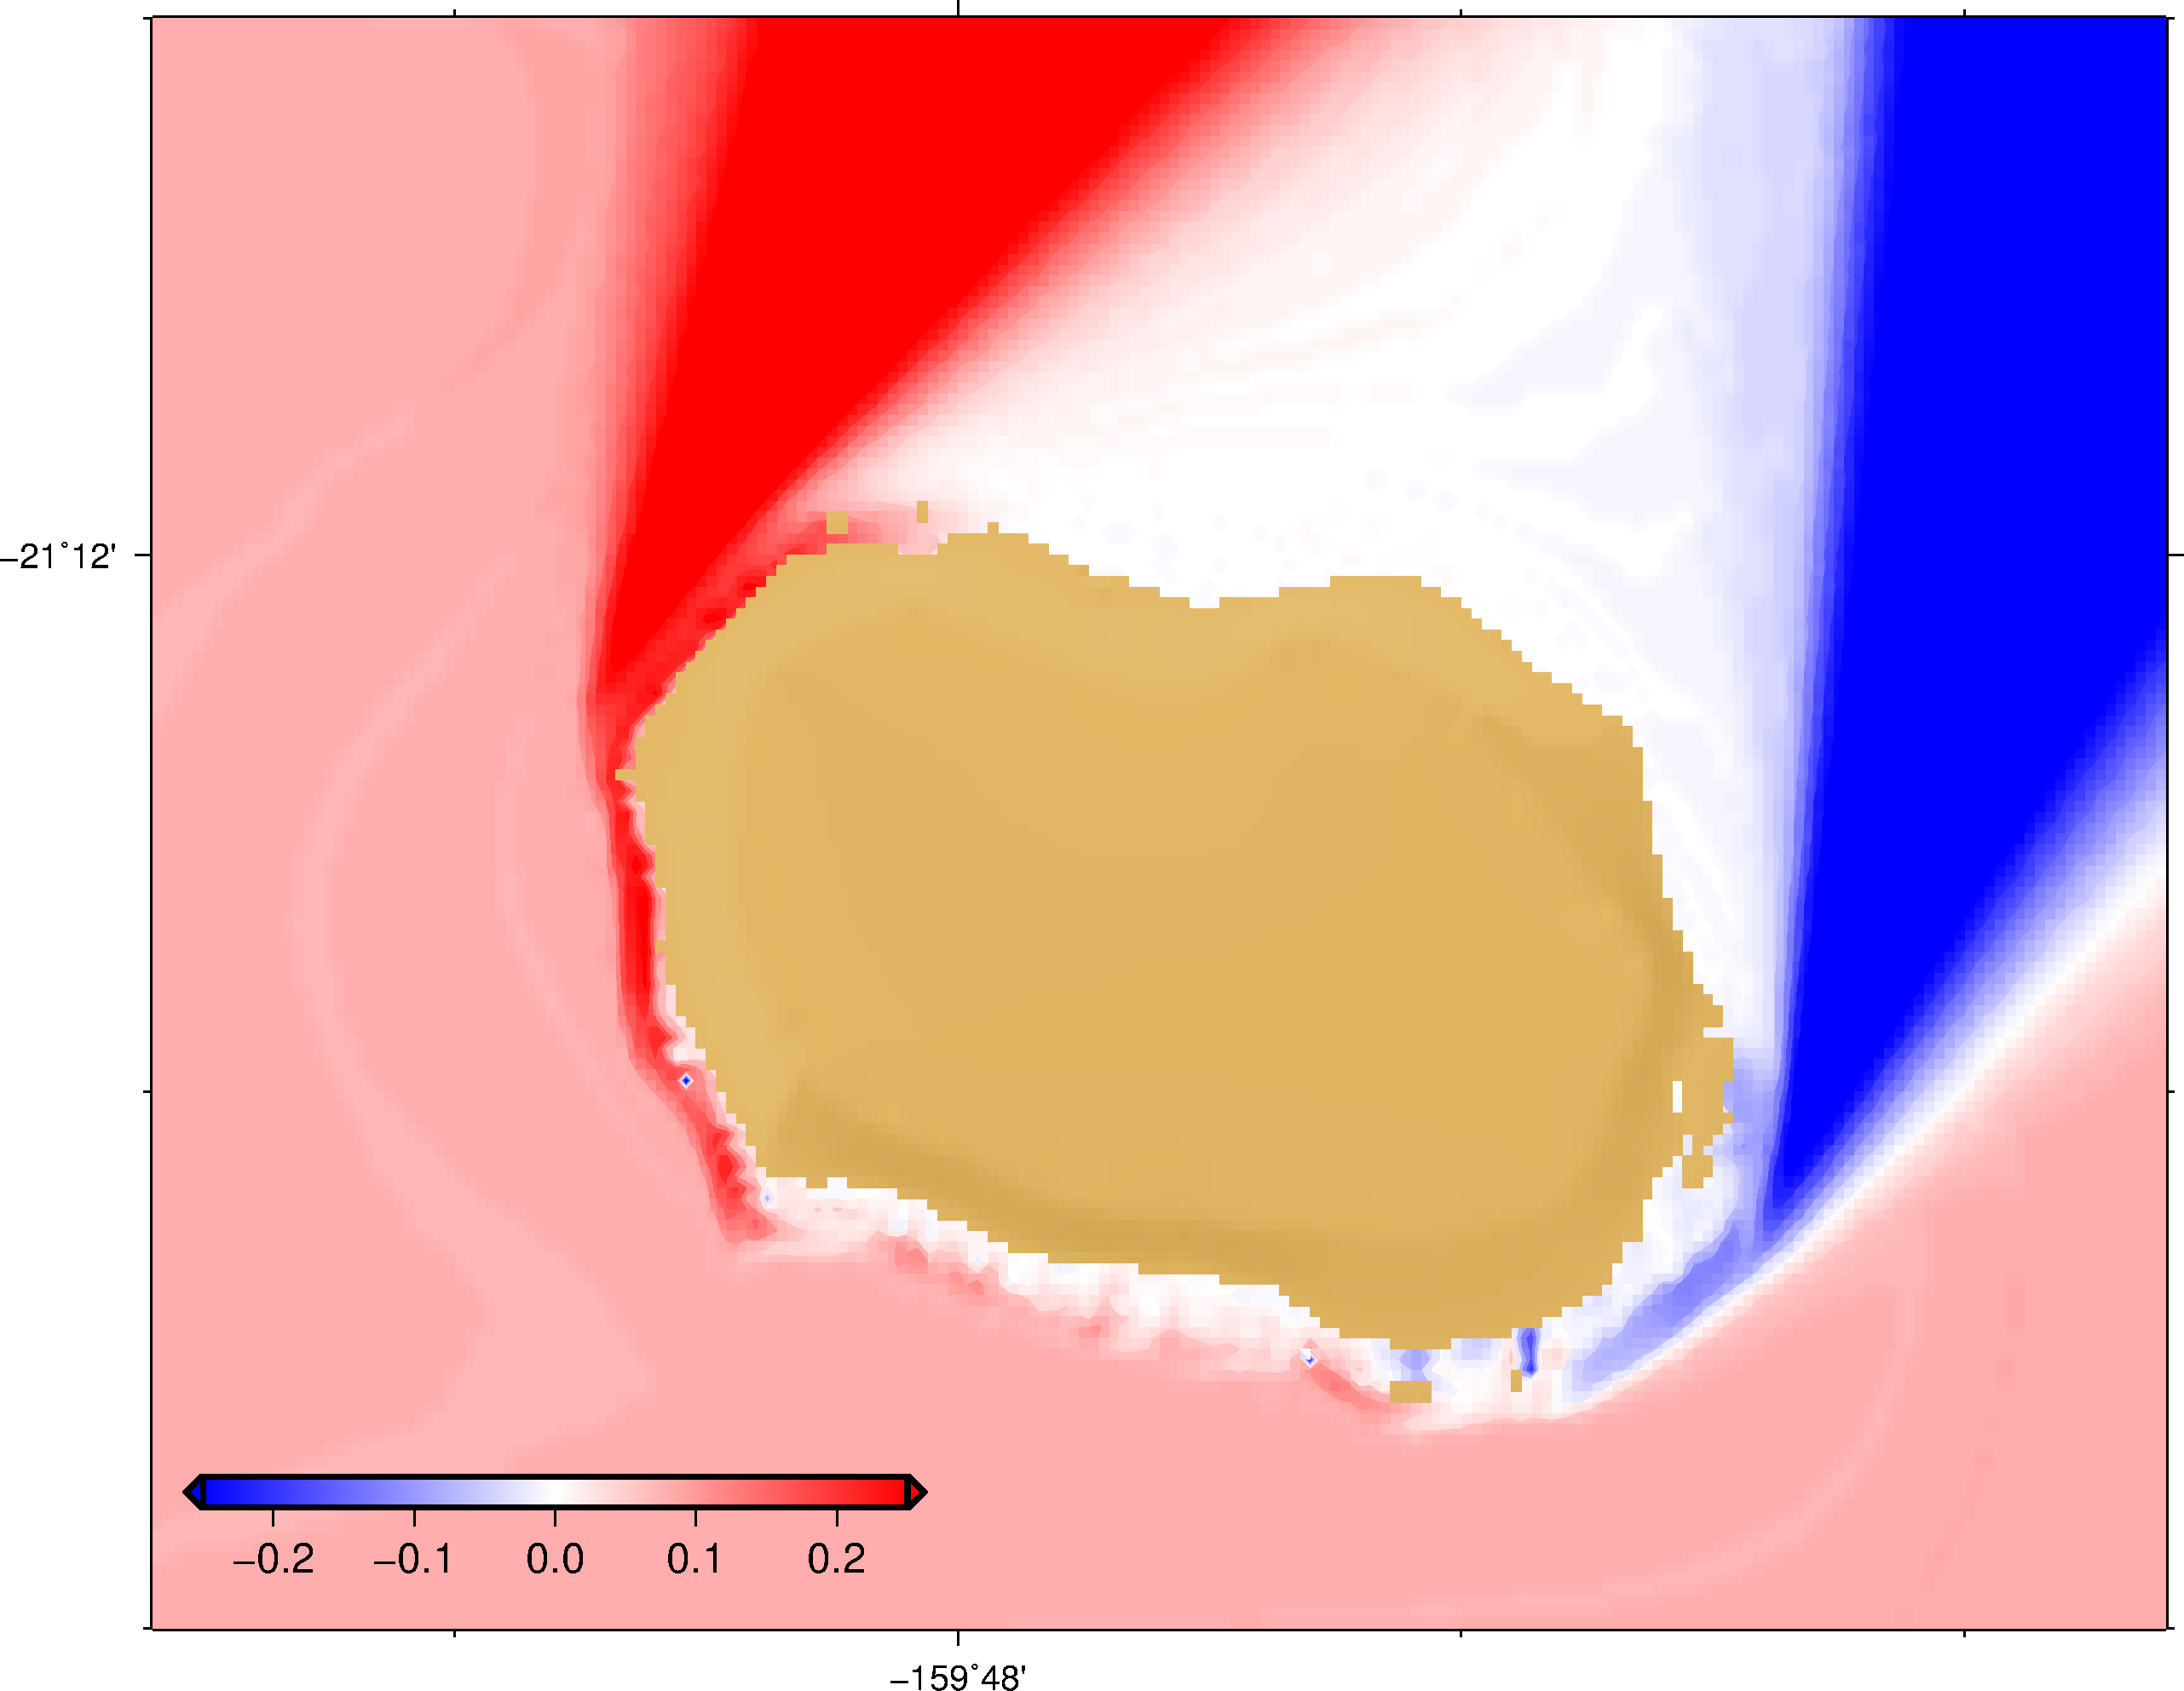
The maps below show the changes in the mean significant wave height for End of 21st Century (END21C) RCP8.5 scenario.
RCP 8.5 Hs Change for January
RCP 8.5 Hs Change for February
RCP 8.5 Hs Change for March
RCP 8.5 Hs Change for April
RCP 8.5 Hs Change for May
RCP 8.5 Hs Change for June
RCP 8.5 Hs Change for July
RCP 8.5 Hs Change for August
RCP 8.5 Hs Change for September
RCP 8.5 Hs Change for October
RCP 8.5 Hs Change for November
RCP 8.5 Hs Change for December
Previous
Next
Further info
To read more about the 4 different models used under CMIP5 click on the links below:
General Information
Hemer, M., Katzey, J. and Hotan, C. (2011). The wind-wave climate of the Pacific Ocean, PACCSAP final report, Canberra: DCCEE.
Trenham, C.,Hemer, M.,Durrant, T., and Greenslade,J (2013). PACCSAP Wind-wave climate: High resolution wind-wave climate and projections of change in the Pacific region for coastal hazard assessments, Melbourne:CAWCR
CNRM-CM5 (Centre National de Recherches Me´te´orologiques – Climate Model)
Coupled Models - CNRM-CM5
Voldoire,A.,Gomez,E.,et al.(2012).The CNRM-CM5.1 Global Climate Model: Description and Basic Evaluation, France:CNRM-GAME.
HadGEM2-ES (Hadley Global Environment Model 2 – Earth System)
CMIP5 Model HadGEM2-ES Overview
INMCM4 (Institute of Numerical Climate Model version 4.0)
Trenham, C.,Hemer, M.,Durrant,T., and Greenslade,J.(2013). PACCSAP Wind-wave climate: High resolution wind-wave climate and projections of change in the Pacific region for coastal hazard assessments, Melbourne:CAWCR
ACCESS1-0 (Australian Community Climate and Earth System Simulator)
ACCESS1-0 climate model output