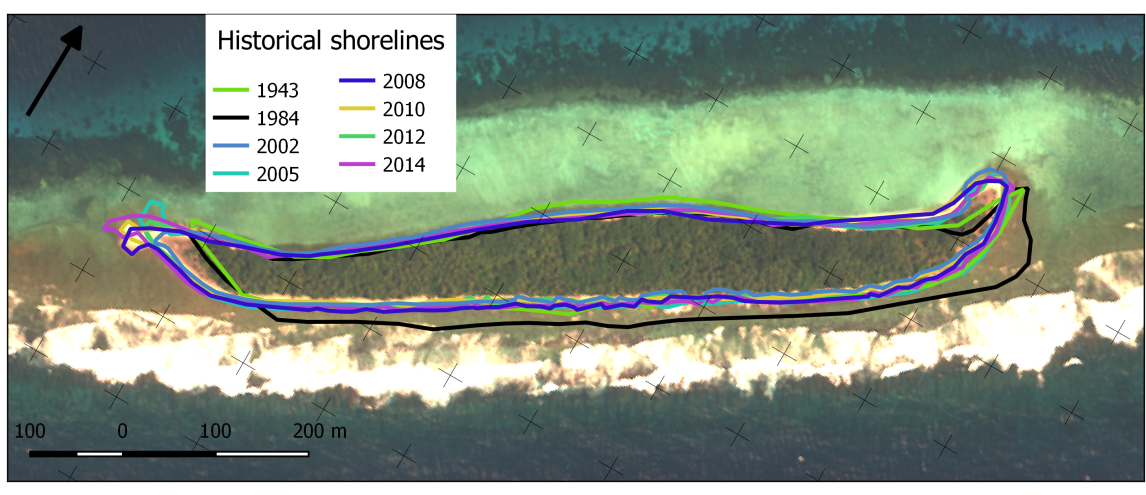
The image below shows the digitized shorelines for Fatato Island
Find out more about the oceanography and morphology of Fatato.
Historical images were georeferenced against the 2010 IKONOS imagery, the resulting error is estimated to be less than 4.0m . The toe of the beach (where visible) was used as a proxy for shoreline (Boak and Turner, 2005) and digitized for the whole island, forming a closed polygon. The area covered by each polygon was calculated and the progressive change in the island footprint estimated.
The digitised shorelines show large changes between 1943 and 1984 with the shoreline on the ocean side prograding 25m, and the area of the island increasing by 15%. By 2002, the shoreline on the ocean side had receded to the 1945 position and the island had migrated to the South West by 45m (29m in the north East end and 60m in the South West end). From 2002 to 2014 the shoreline on both the lagoon side and the ocean side have shown only small variation (less than 11m of maximum deviation).
As seen in the image below, there seems to be accretion on the South side of the island in 1984. This was due to Hurricane Bebe, a Cat 3 cyclone which affected Tuvalu between October 20 - 22 1972. The wind and wave activity during the cyclone deposited large amounts of sand on the shore resulting in the increase in the size of the island by 15%. Later on that same area had receded to its earlier position due to wave activity while pushing that sand to the western part of the island. Over time there seems to also be a decrease in the island size on the north side of the island.
The table below showes the summary of area covered by Fatato Island since 1943
| Imagery date | Area (m2) | Area change since 1943 (%) |
|---|---|---|
| 1943 | 69,620 | 0 |
| 1984 | 79,767 | 15 |
| 2002 | 66,061 | -5 |
| 2005 | 72,232 | 4 |
| 2008 | 69,916 | 0 |
| 2010 | 66,791 | -4 |
| 2012 | 66,313 | -5 |
| 2014 | 71,115 | 2 |
The image below shows the digitized shorelines for Fatato Island