The models skill is more than 0.9 and the bias is in the negatives indicating that the model is very accurate. The RMS is within the expected error for this type of model.
The scatter of the comparison and the quantile show a more detailed analysis of the models' performance.
Model vs measured waves
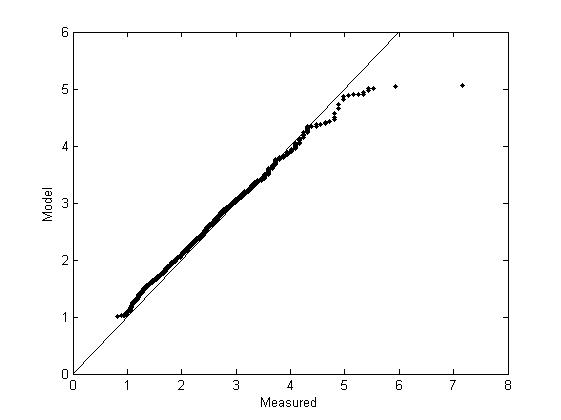
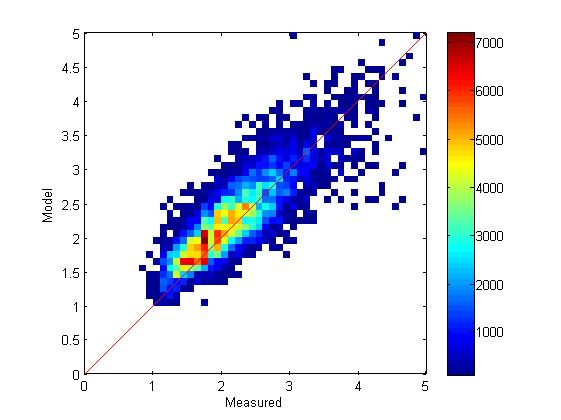
The scatter plot shows the divergence between the model and measurements. The spread of the scatter is relatively uniform across all the measured wave heights suggesting that the model is valid for wave heights between 0.0m and 5.0m. The quantile/quantile plot shows how the bias varies with different wave heights. The bias is relatively small for wave heights below 5.0m which corresponds to all the trade wind waves and swells. Larger waves are often created by nearby cyclones which are not well resolved in the model.
Scatter plots
Model vs Measured
Quantile/Quantile plot