Wave Buoy Location Map
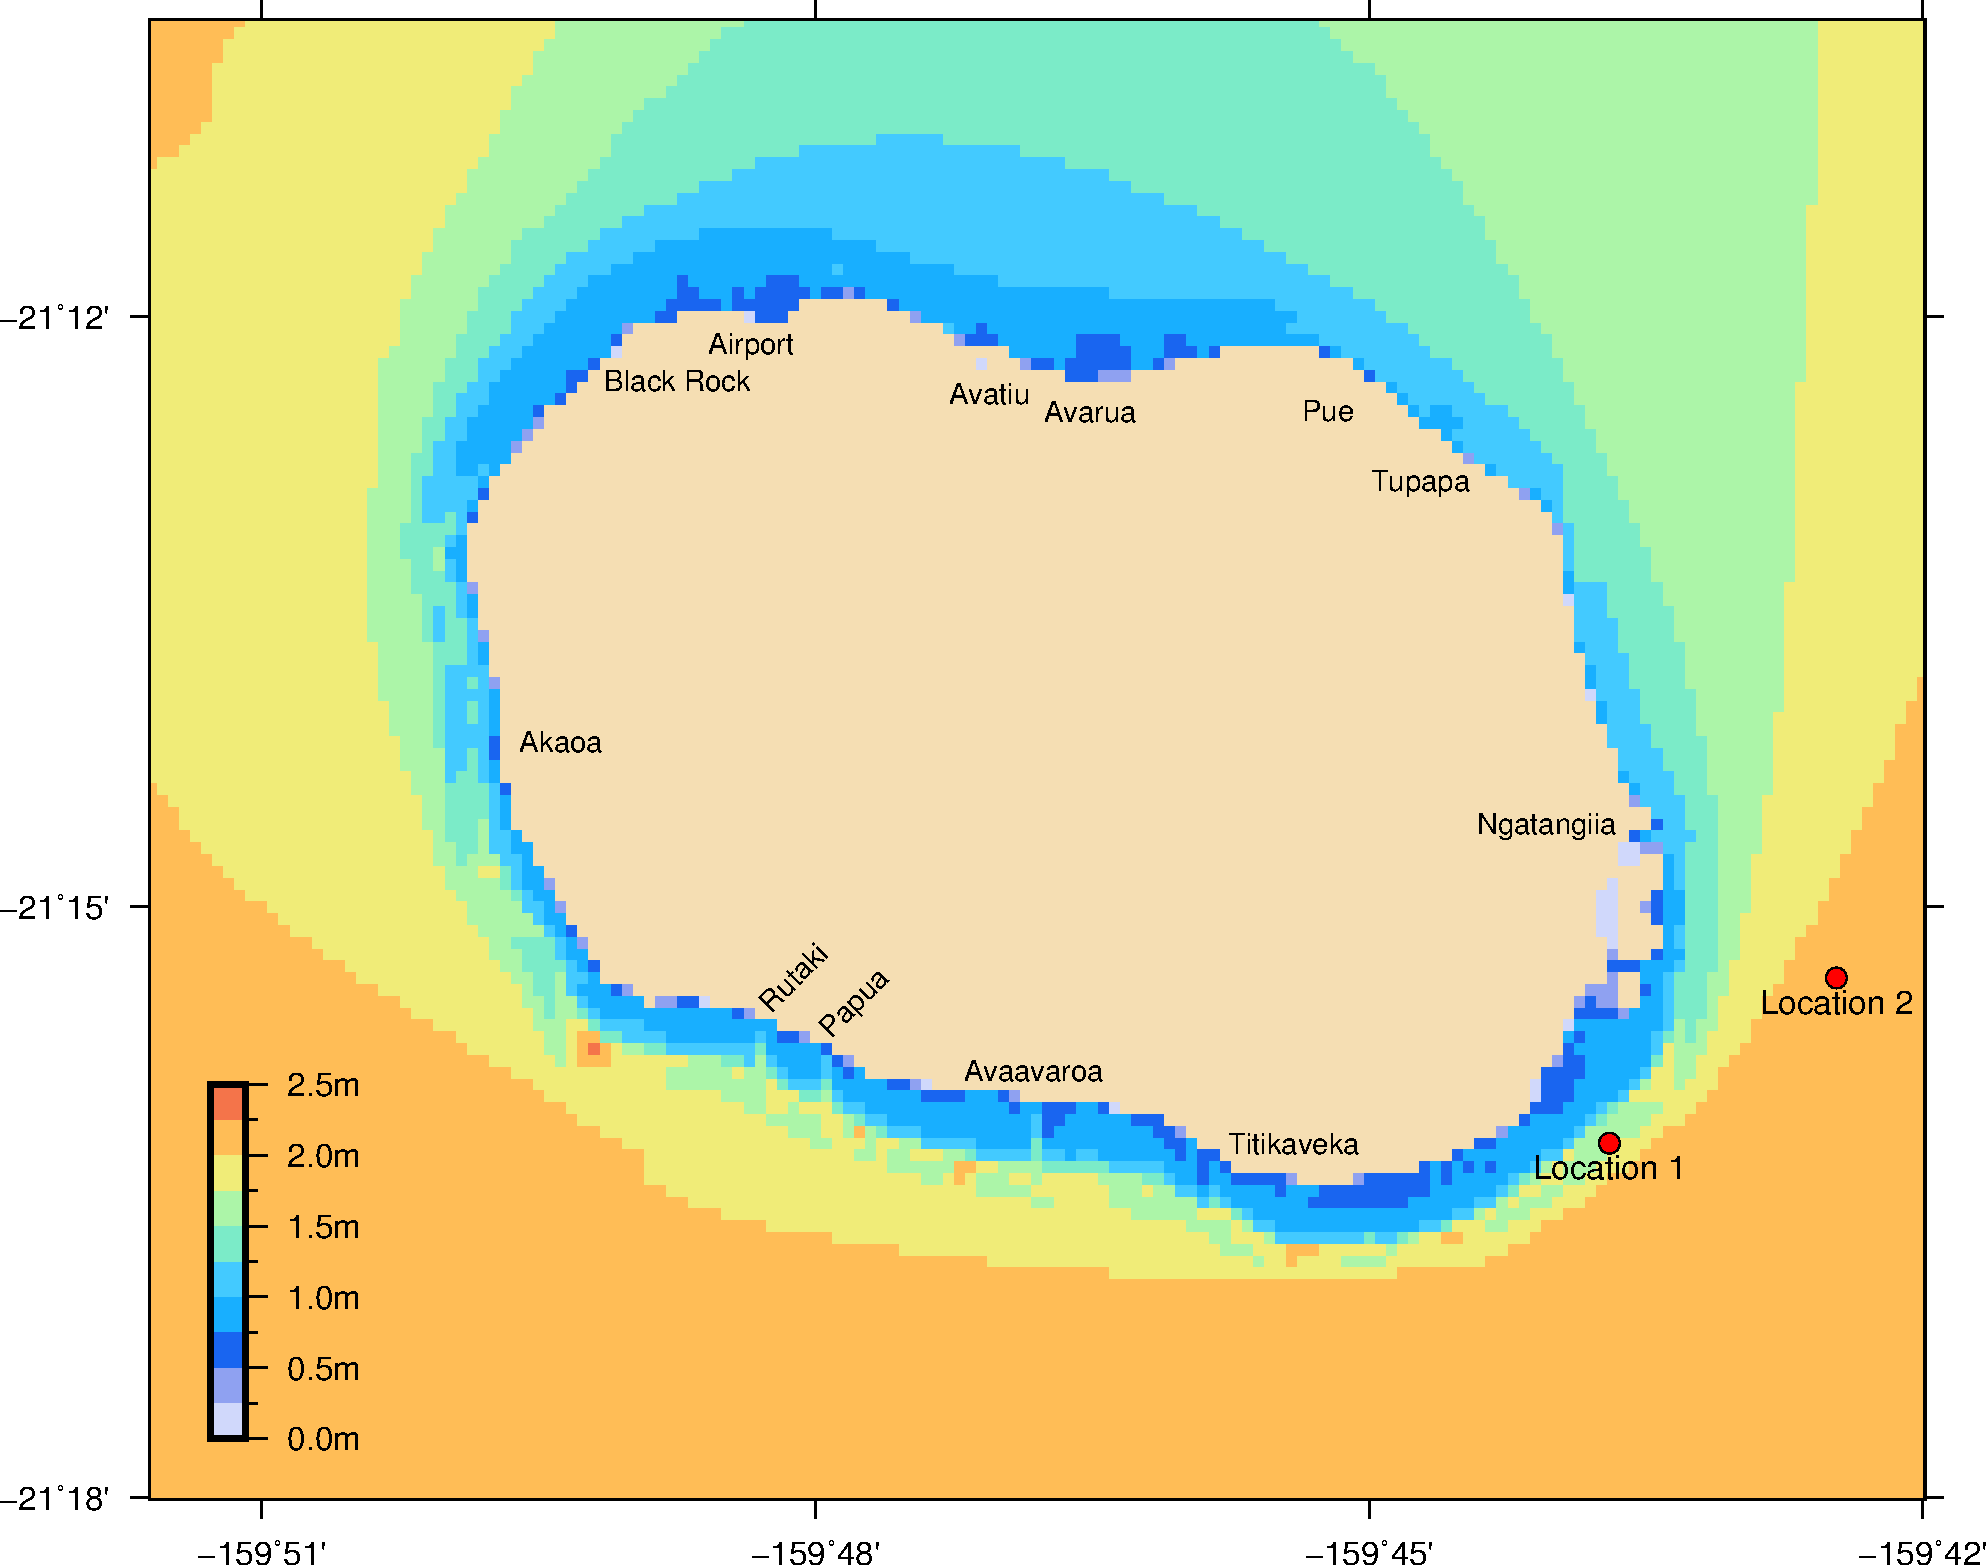
The map below shows the location of the wave buoys southeast of Rarotonga in a region exposed to south swells and trade wind waves.
This page shows the validation plots for Rarotonga.
Model validation was carried out in order to check the models accuracy against the measured waves.
In Rarotonga, waves were measured during a long period of time at 2 locations as shown on the map below. Location 1 has measurements conducted from 18/07/1987 - 22/02/1990 while location 2 was from 24/04/1990 - 25/10/1991.
The map below shows the location of the wave buoys southeast of Rarotonga in a region exposed to south swells and trade wind waves.
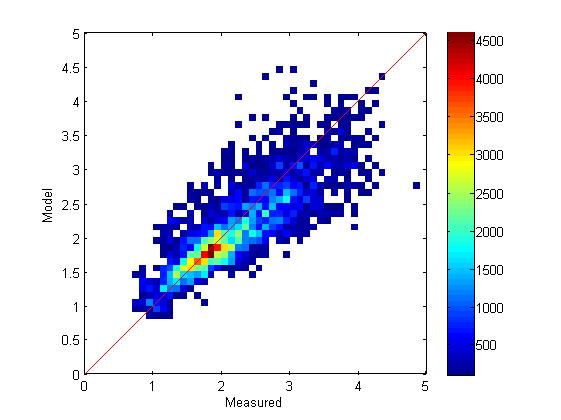
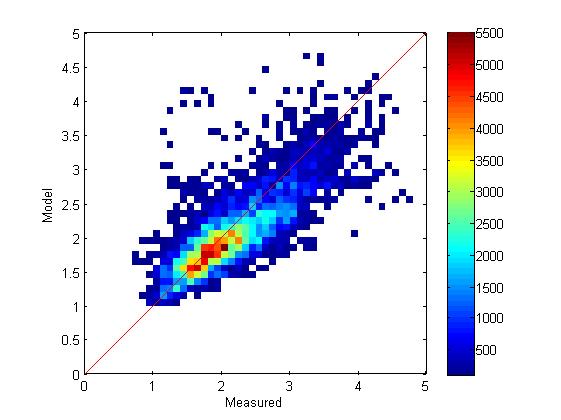
The tables below shows the Root Mean Square Error, skill and Bias of the model.
| Location | RMS | Skill | Bias |
|---|---|---|---|
| Location 1 | 0.3691 | 0.9259 | 0.0459 |
| Location 2 | 0.3496 | 0.9294 | 0.0460 |
The model skill is greater than 0.9 and the bias is relatively small which means the model is accurate. The RMS is within the expected error for this type of model.
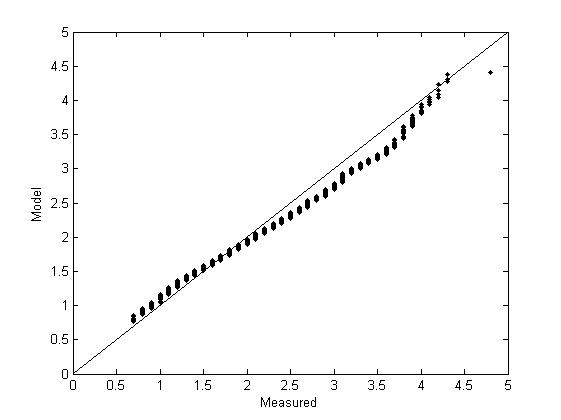
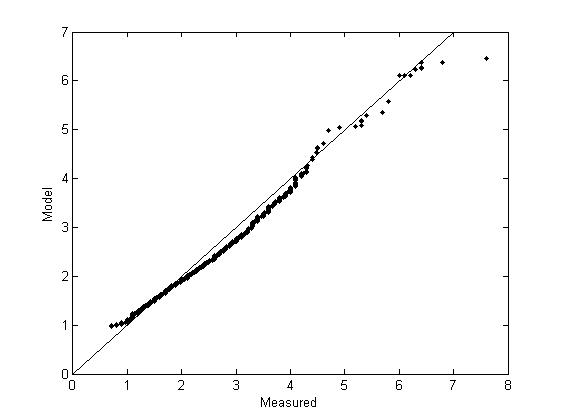
The scatter of the comparison and the quantile show a more detailed analysis of the models' performance.
The scatter plot shows the divergence between the model and measurements. The spread of the scatter is relatively uniform across all the measured wave heights suggesting that the model is valid for wave heights between 0.0m and 5.0m. The quantile/quantile plot shows how the bias varies with different wave heights. The bias is relatively small for wave heights below 5.0m which corresponds to all the trade wind waves and swells. Larger waves are often created by nearby cyclones which are not well resolved in the model.