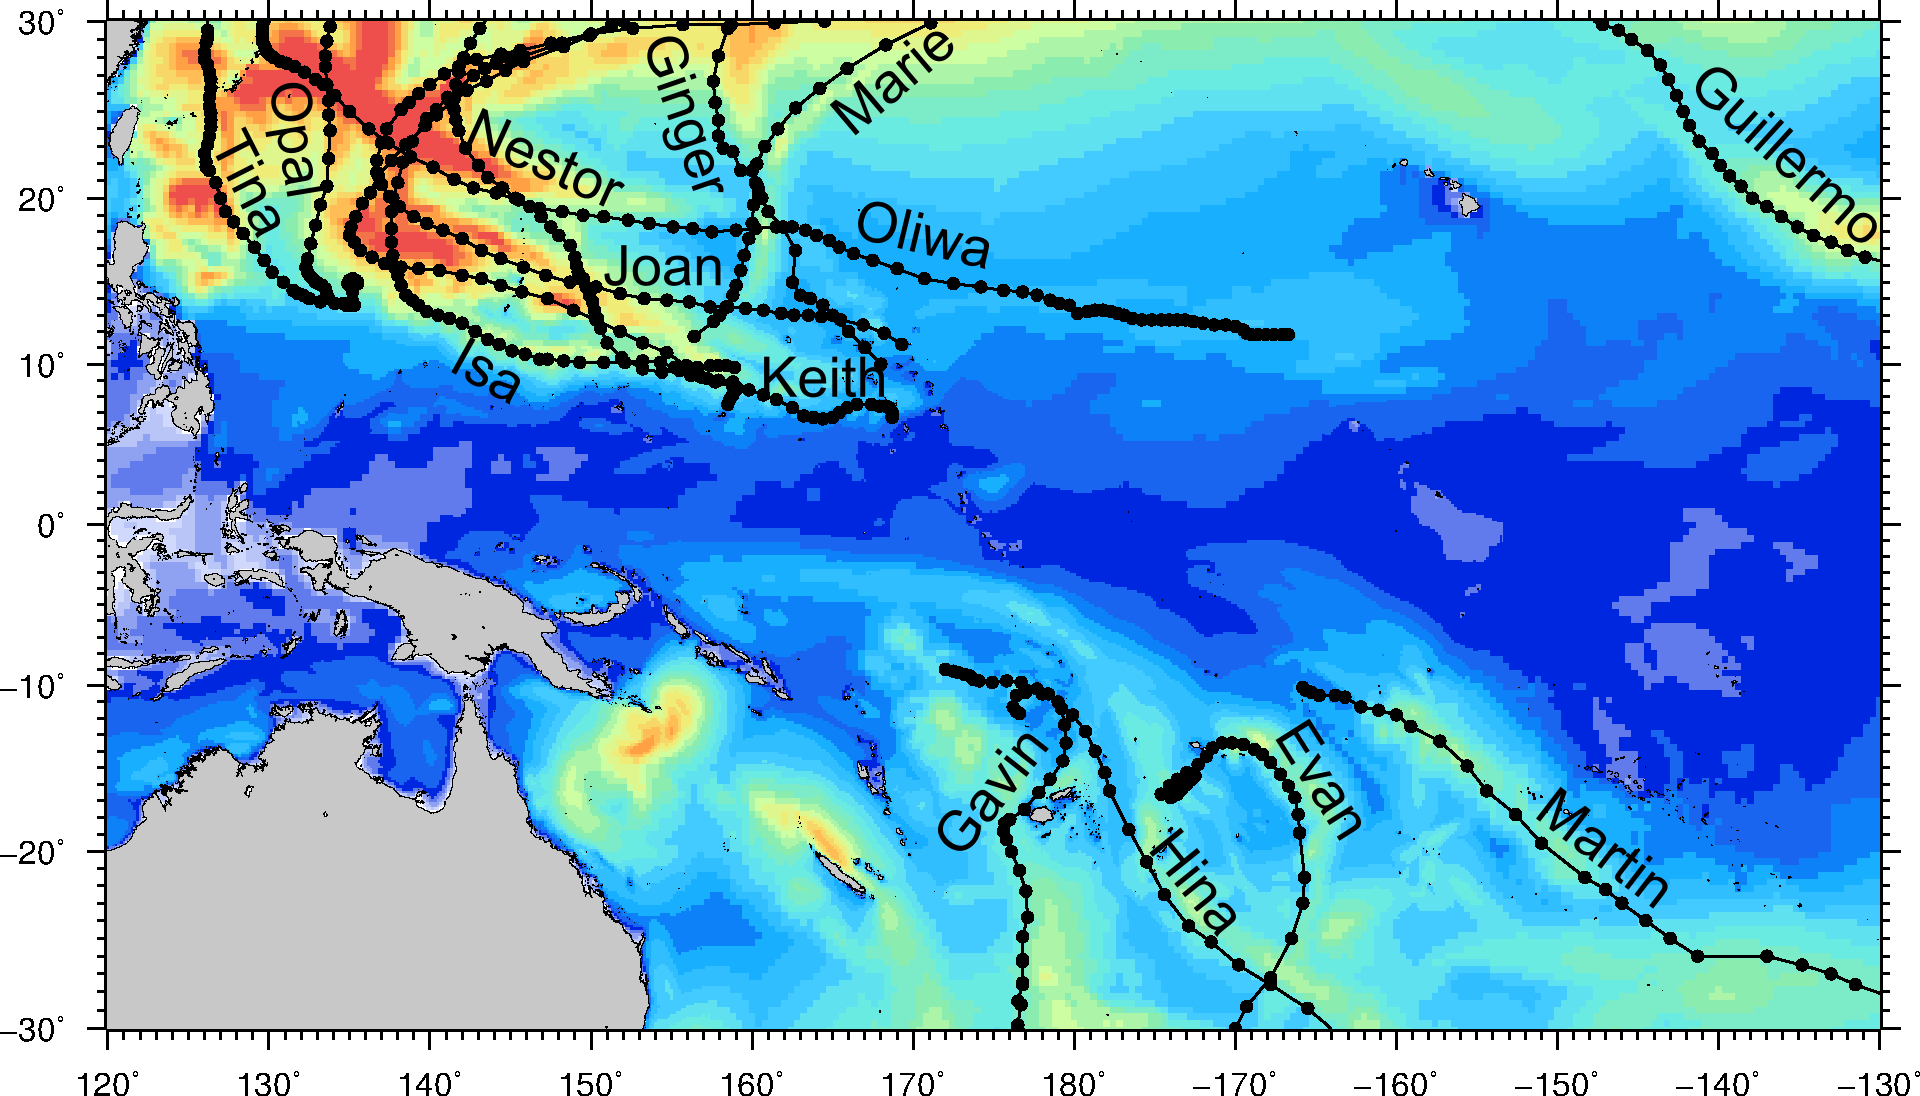
Maximum wave height for each year since 1979
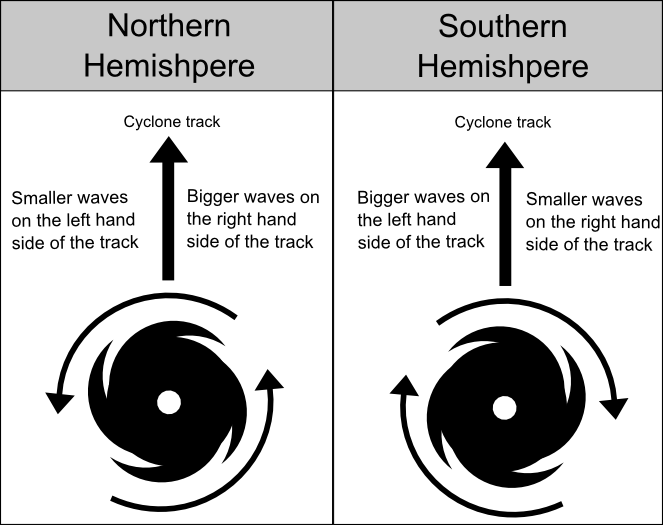
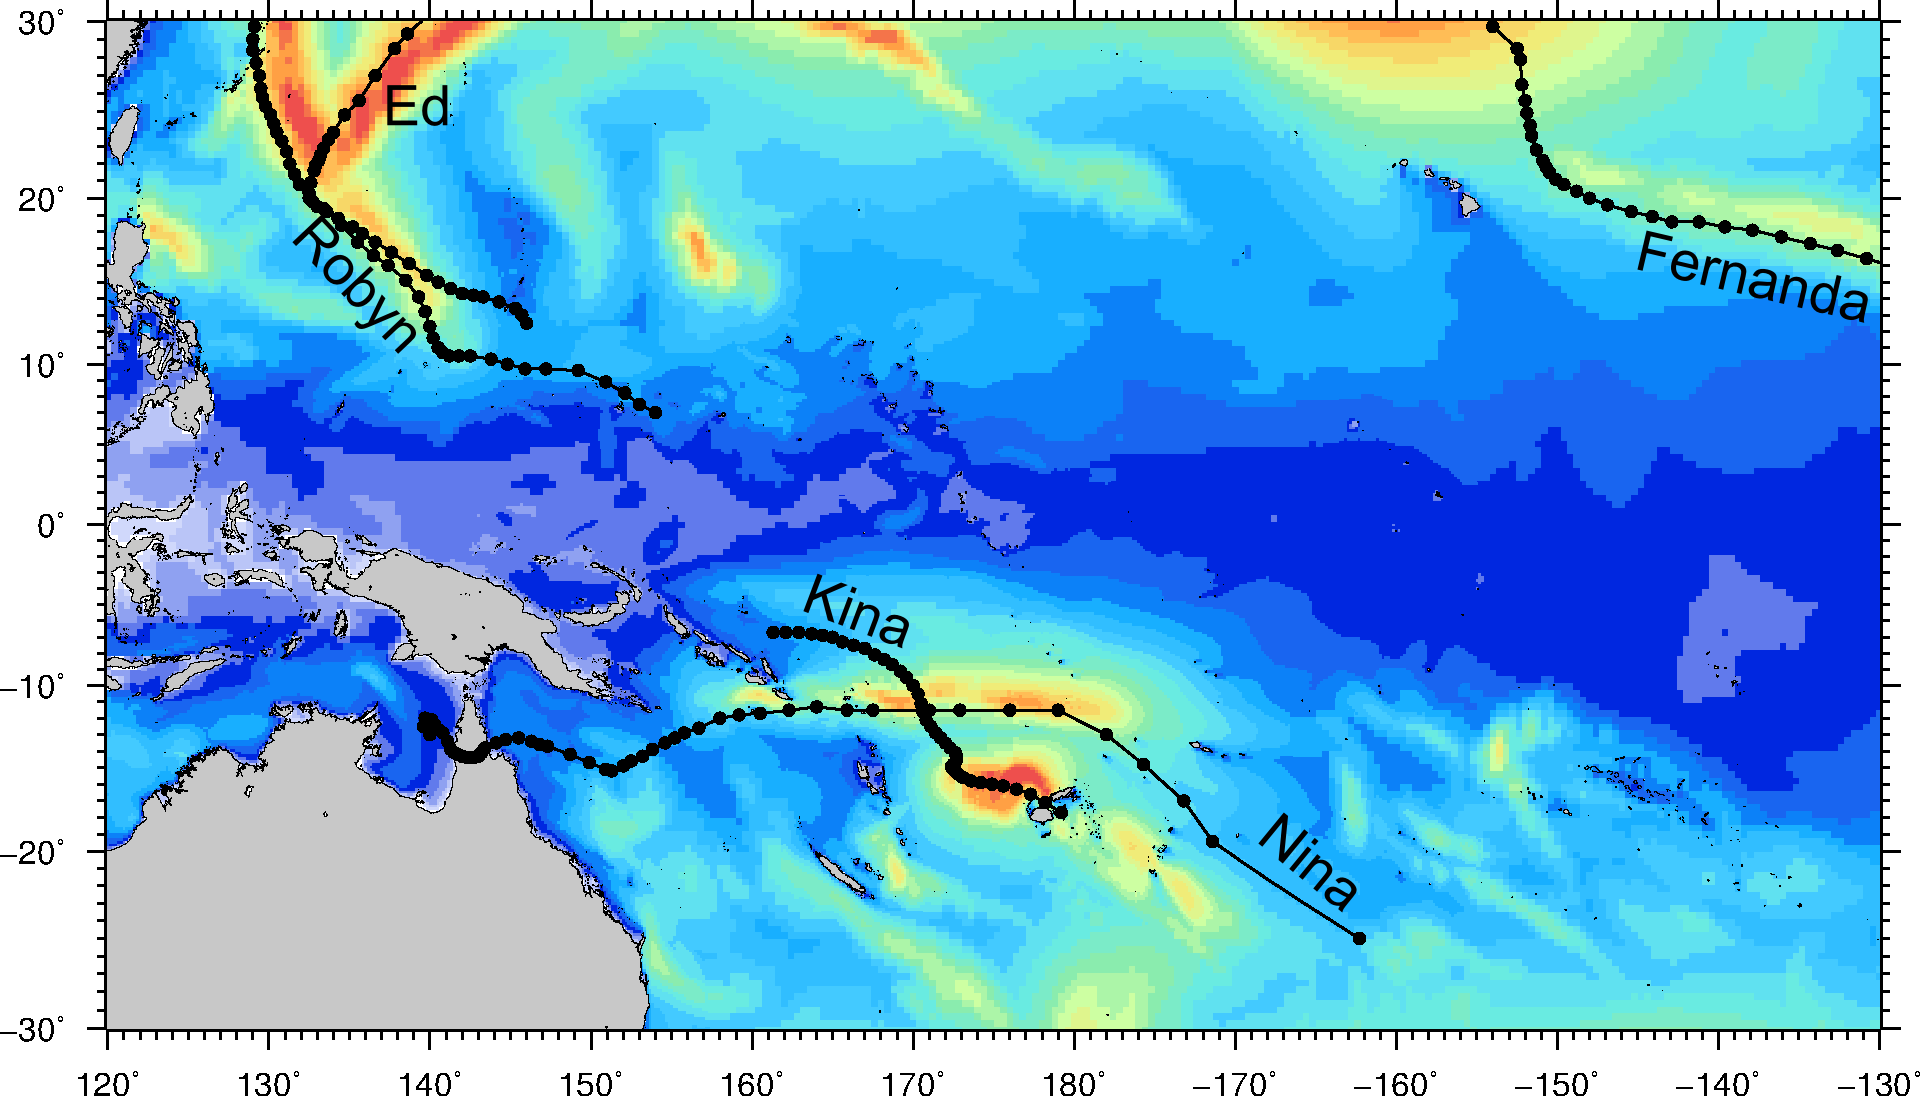
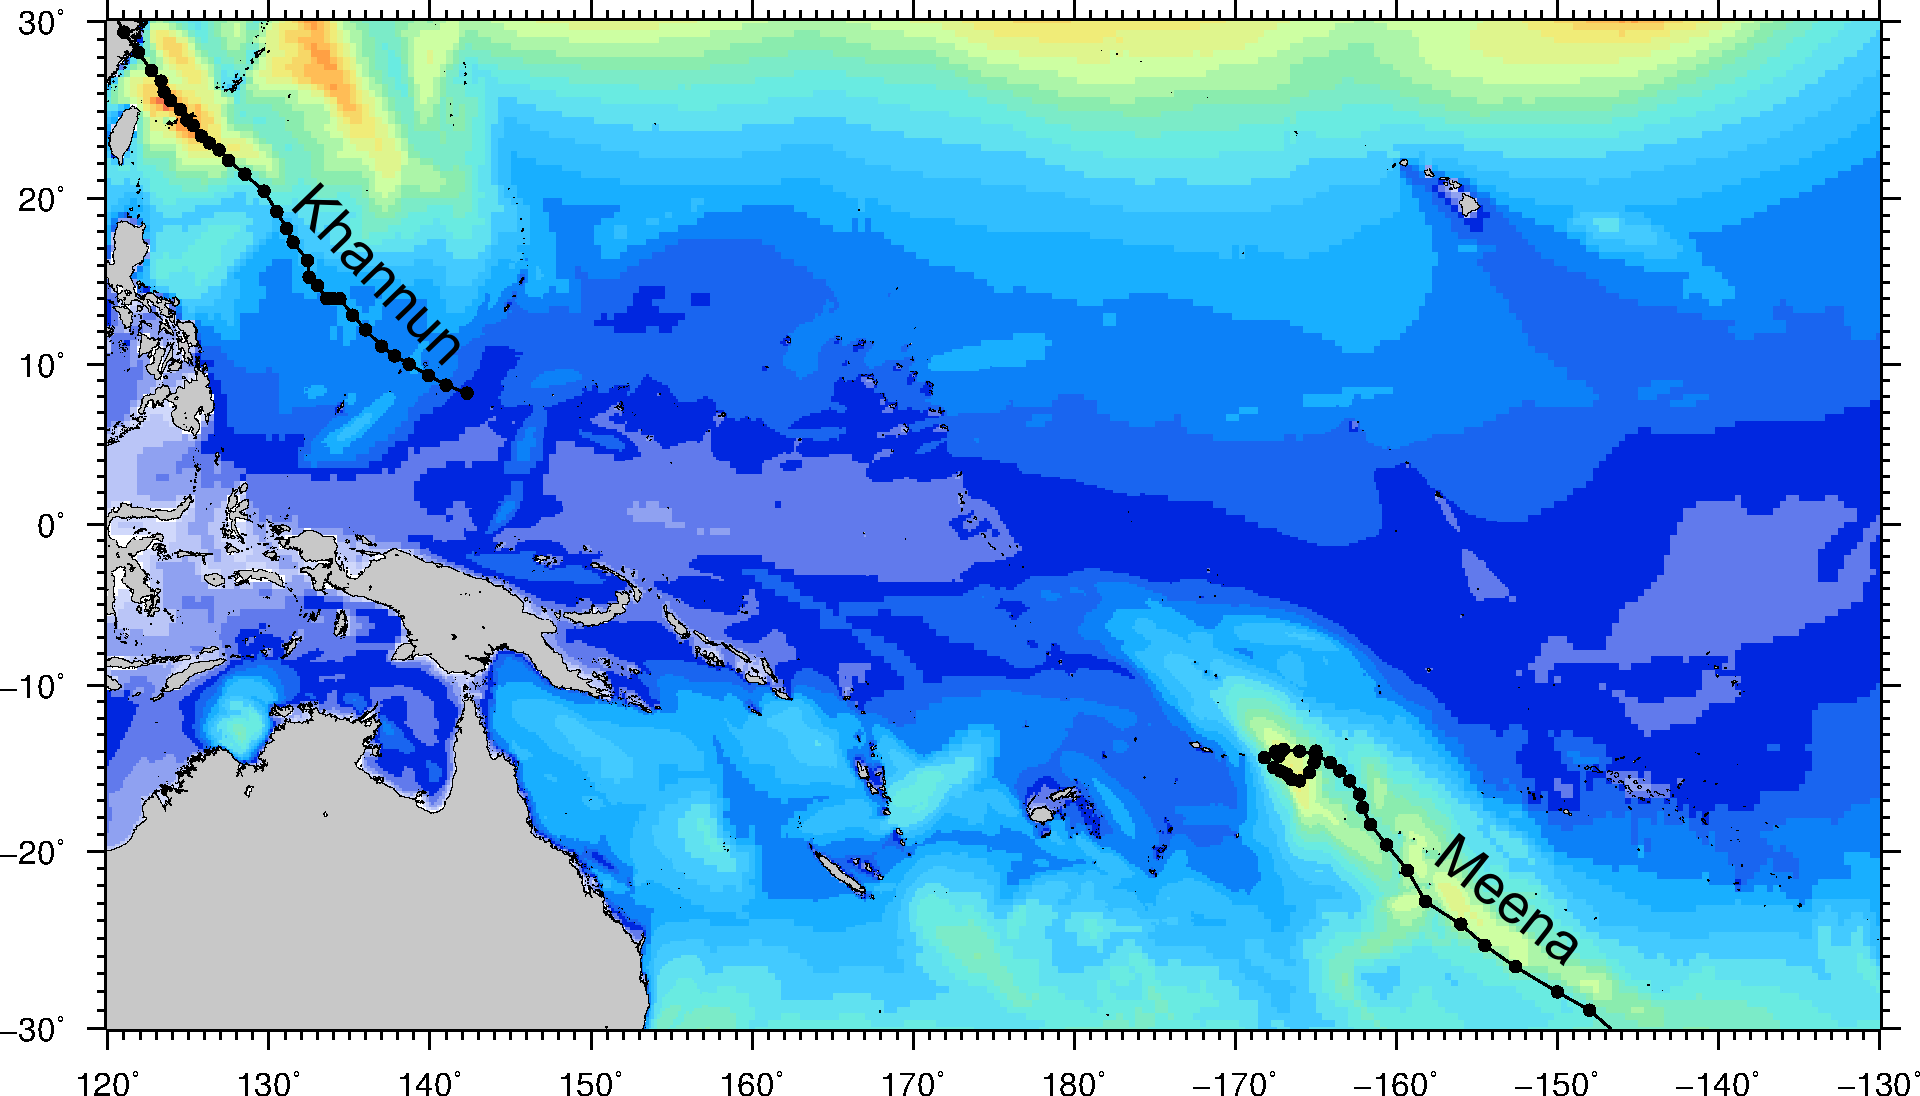
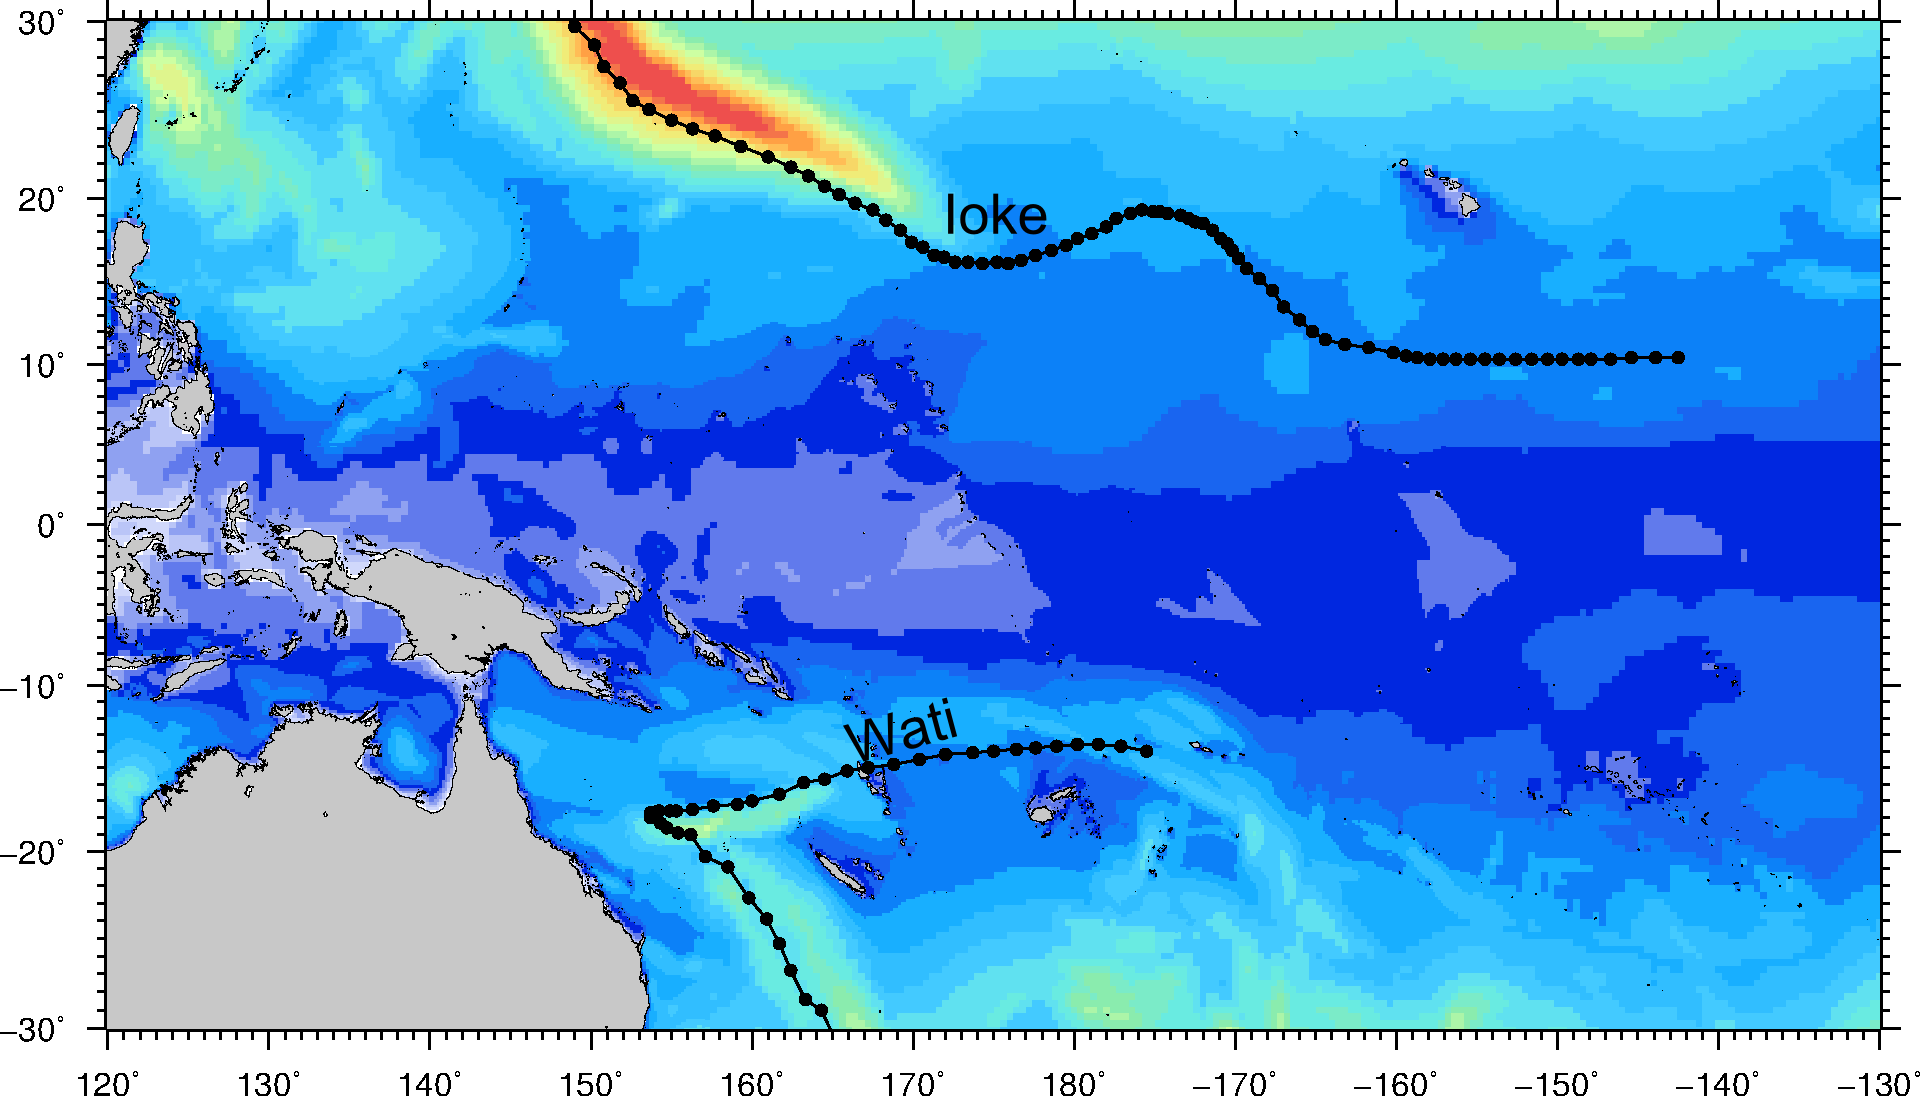
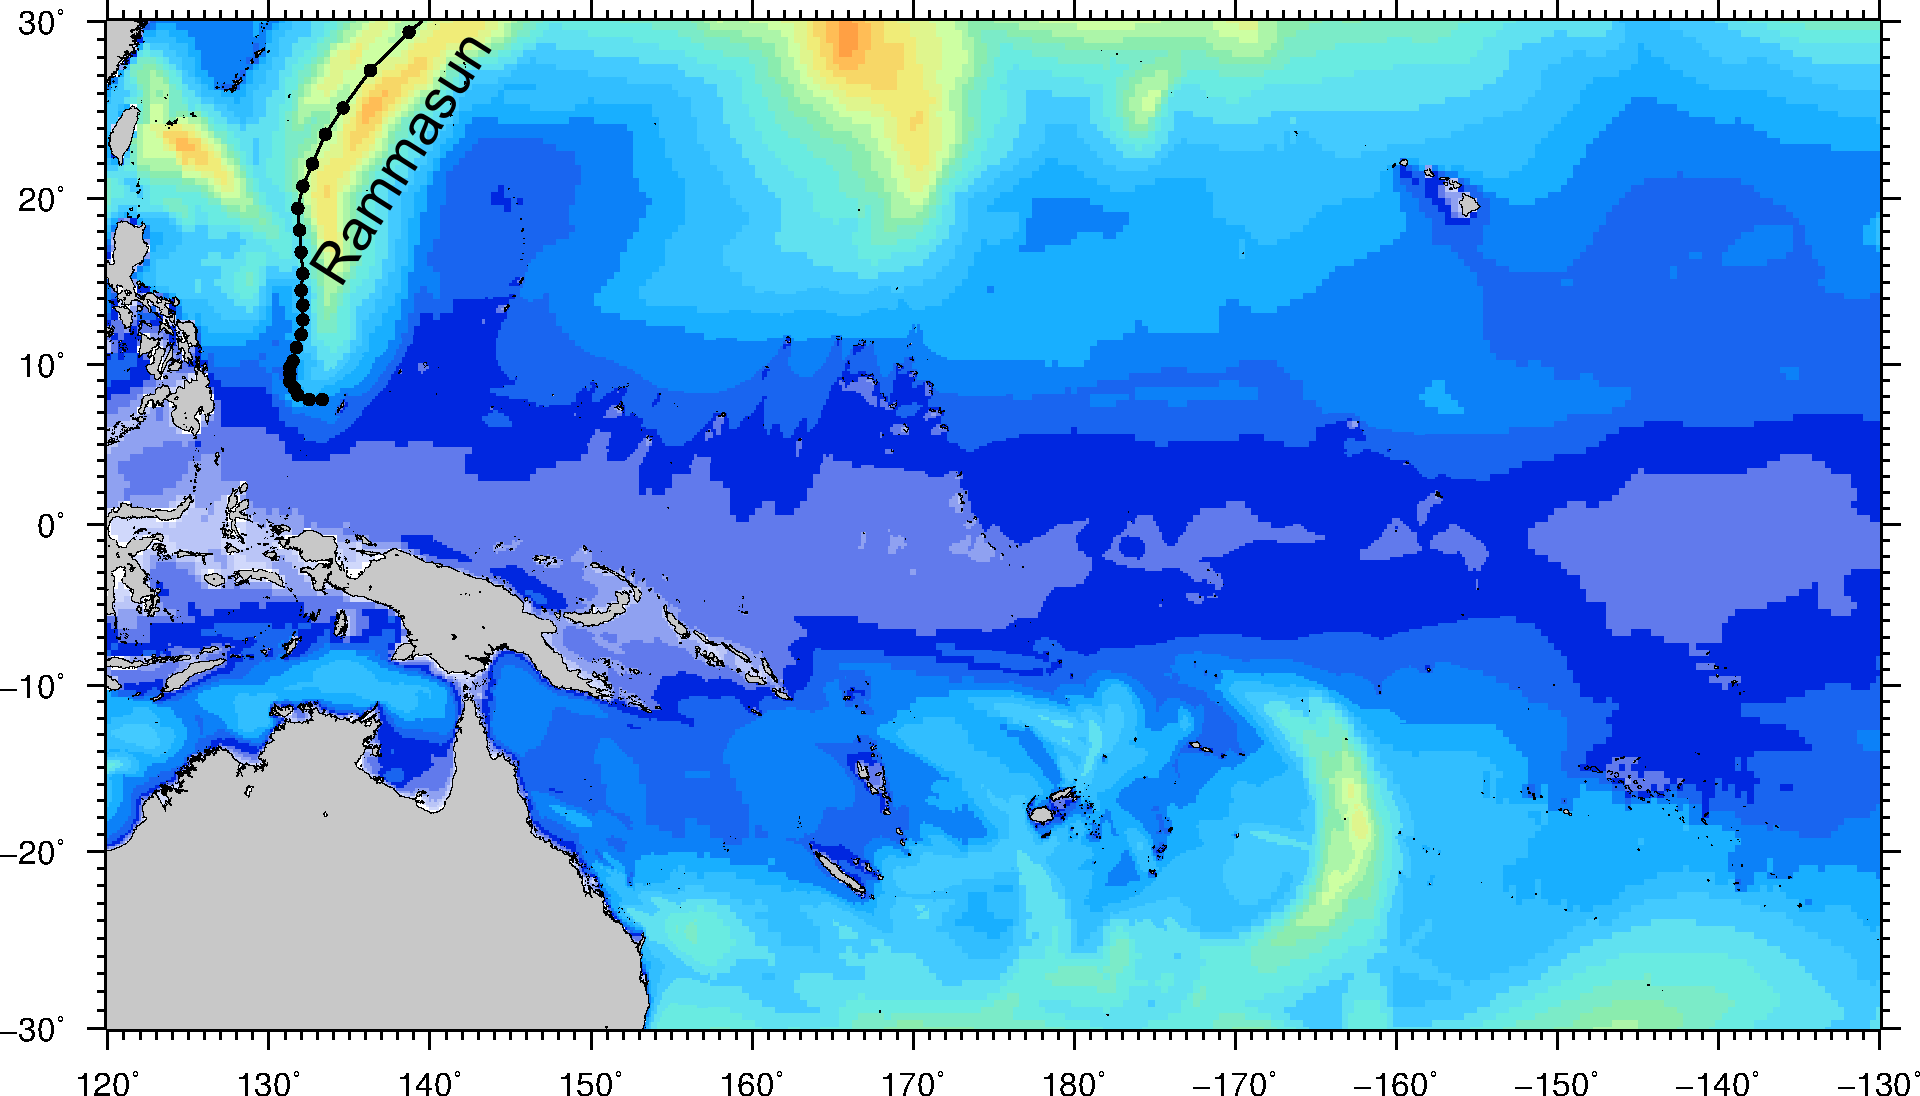
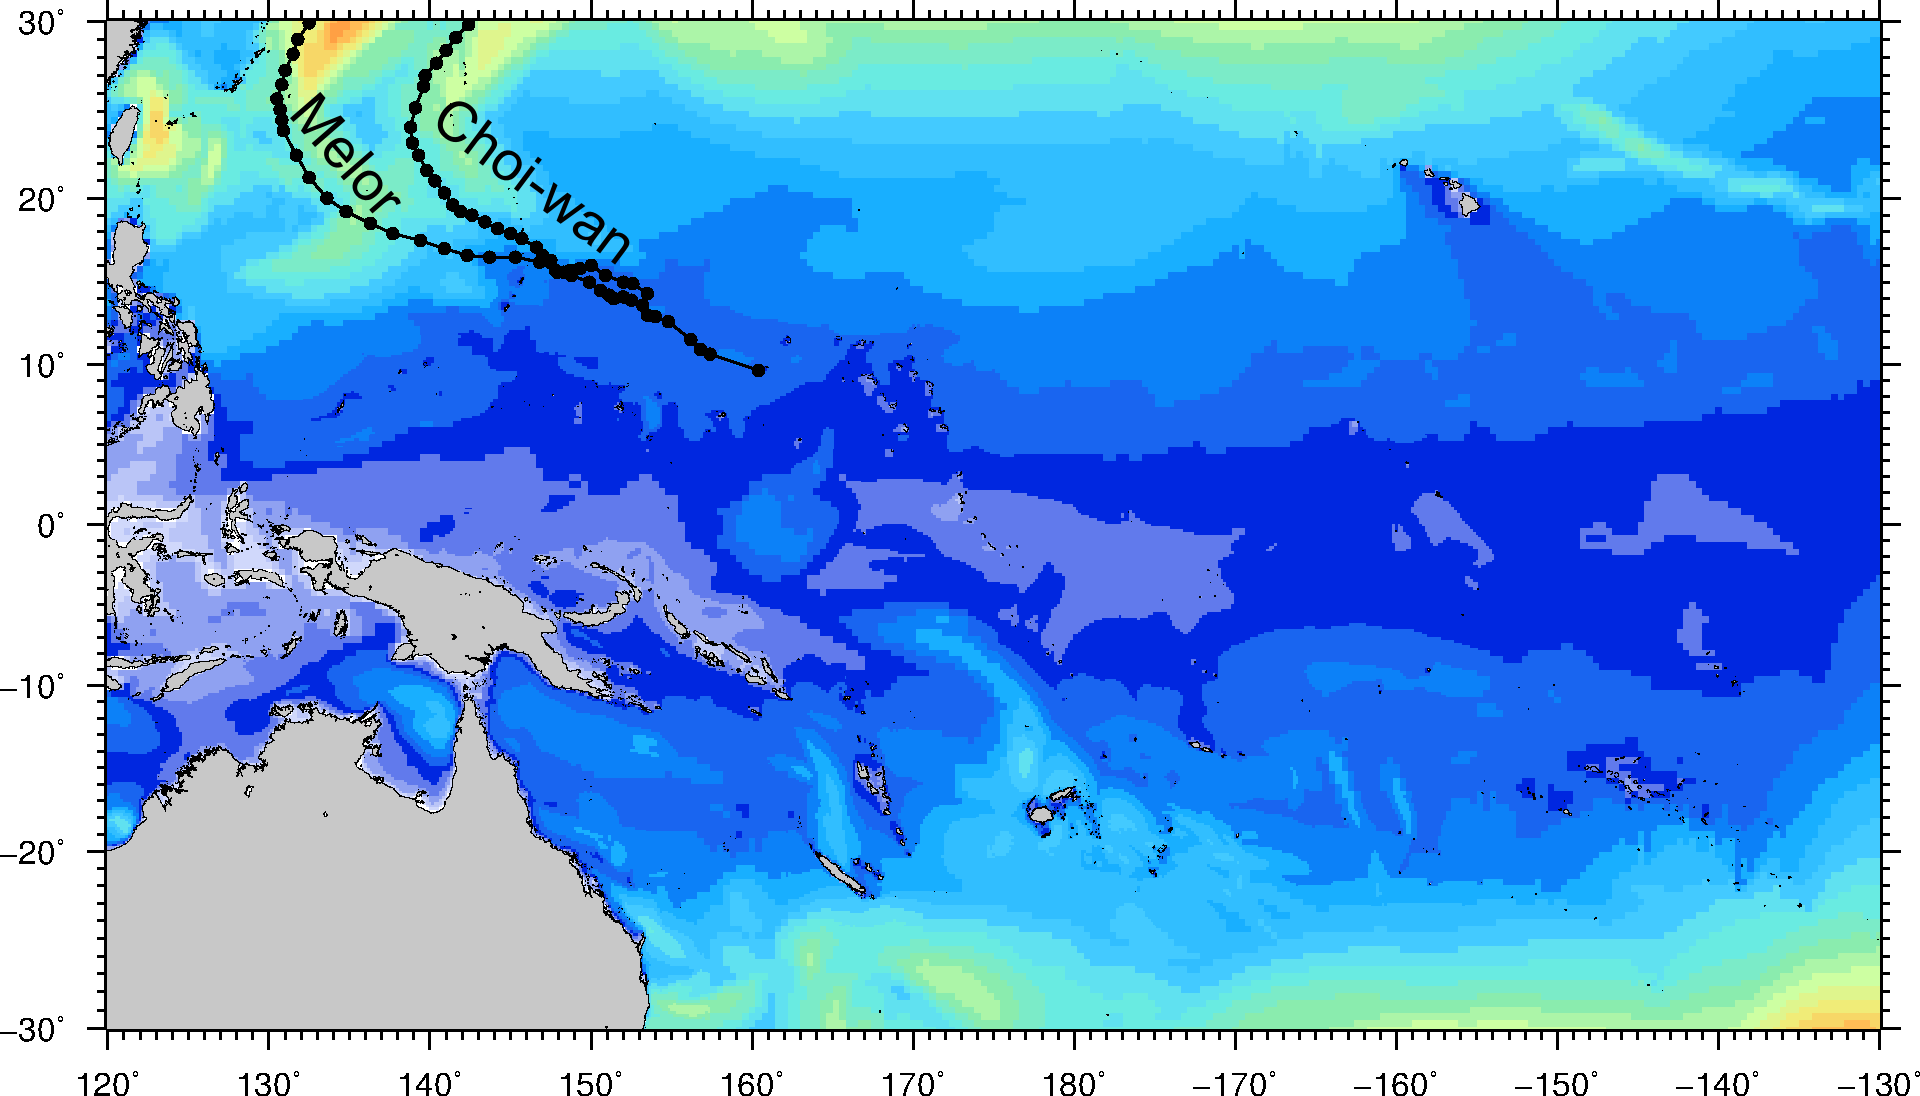
Large waves happen in the proximity of storms and Tropical Cyclones (Typhoons in the North East Pacific and Hurricanes in the North West Pacific). However, the largest waves don't necessarily come from the largest storms but can also come from small topical storms that travel at the right speed and can produce waves as big as a cat. 5 cyclone (Typhoon/Hurricane). In the deep ocean, swell waves travel at around 15m/s (approx. car speed limit in town). If a storm travels at this speed (the speed at the centre of the storm and not its wind speed) and in a straight direction, the wind will always blow on the same waves. As a result these waves will keep on growing. However, if a storm is stationary, the waves propagate away from the storm so they never become very big. A similar process is at play for Tropical Cyclones (Typhoons/Hurricanes). In the Southern Hemisphere, Tropical Cyclones winds flow clockwise so the waves on the left-hand side of the Cyclone track keep being fed by the cyclone wind while the waves on the right hand side are pushed away from the cyclone. As a results waves on the left hand side of cyclone are much bigger than on the right hand side. Since the wind direction is reversed in the Northern hemisphere the opposite happens where the waves on the right hand side are much bigger than on the left of the track (see figure below).
1979 - 1989
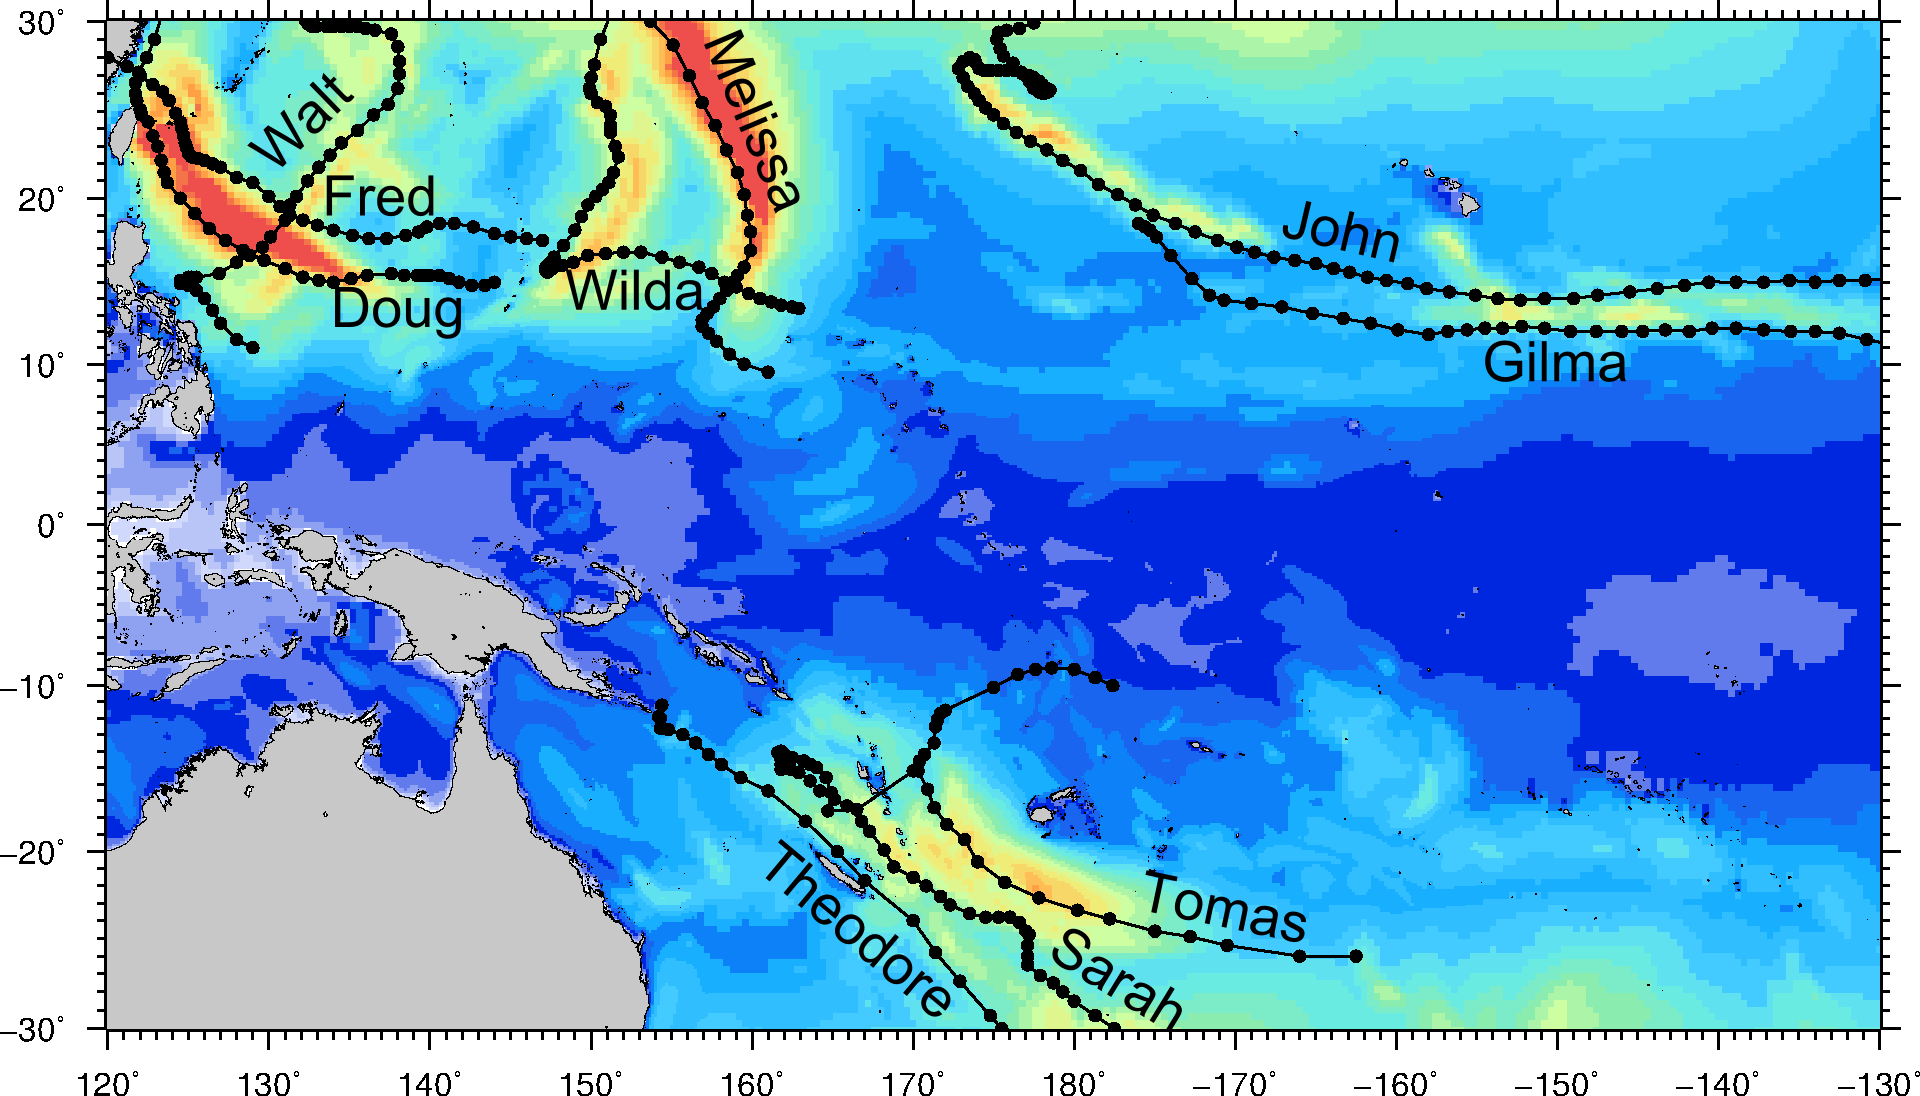
The Maps below show the maximum wave height for each year between 1979 and 1989. This decade saw a lot of Typhoons, especially during the strong El Nino of 1982-1983. Typhoon Tip (1979) is the one that produced the largest waves and had the largest footprint.
Because of El Nino, there were fewer cyclones in the Southern Pacific with TC Bola (1988) being the most noticeable (for waves). Bola, was not a very strong cyclone but produced some of the largest waves in the South Pacific because it kept a relatively straight path and an ideal speed to generate big waves.
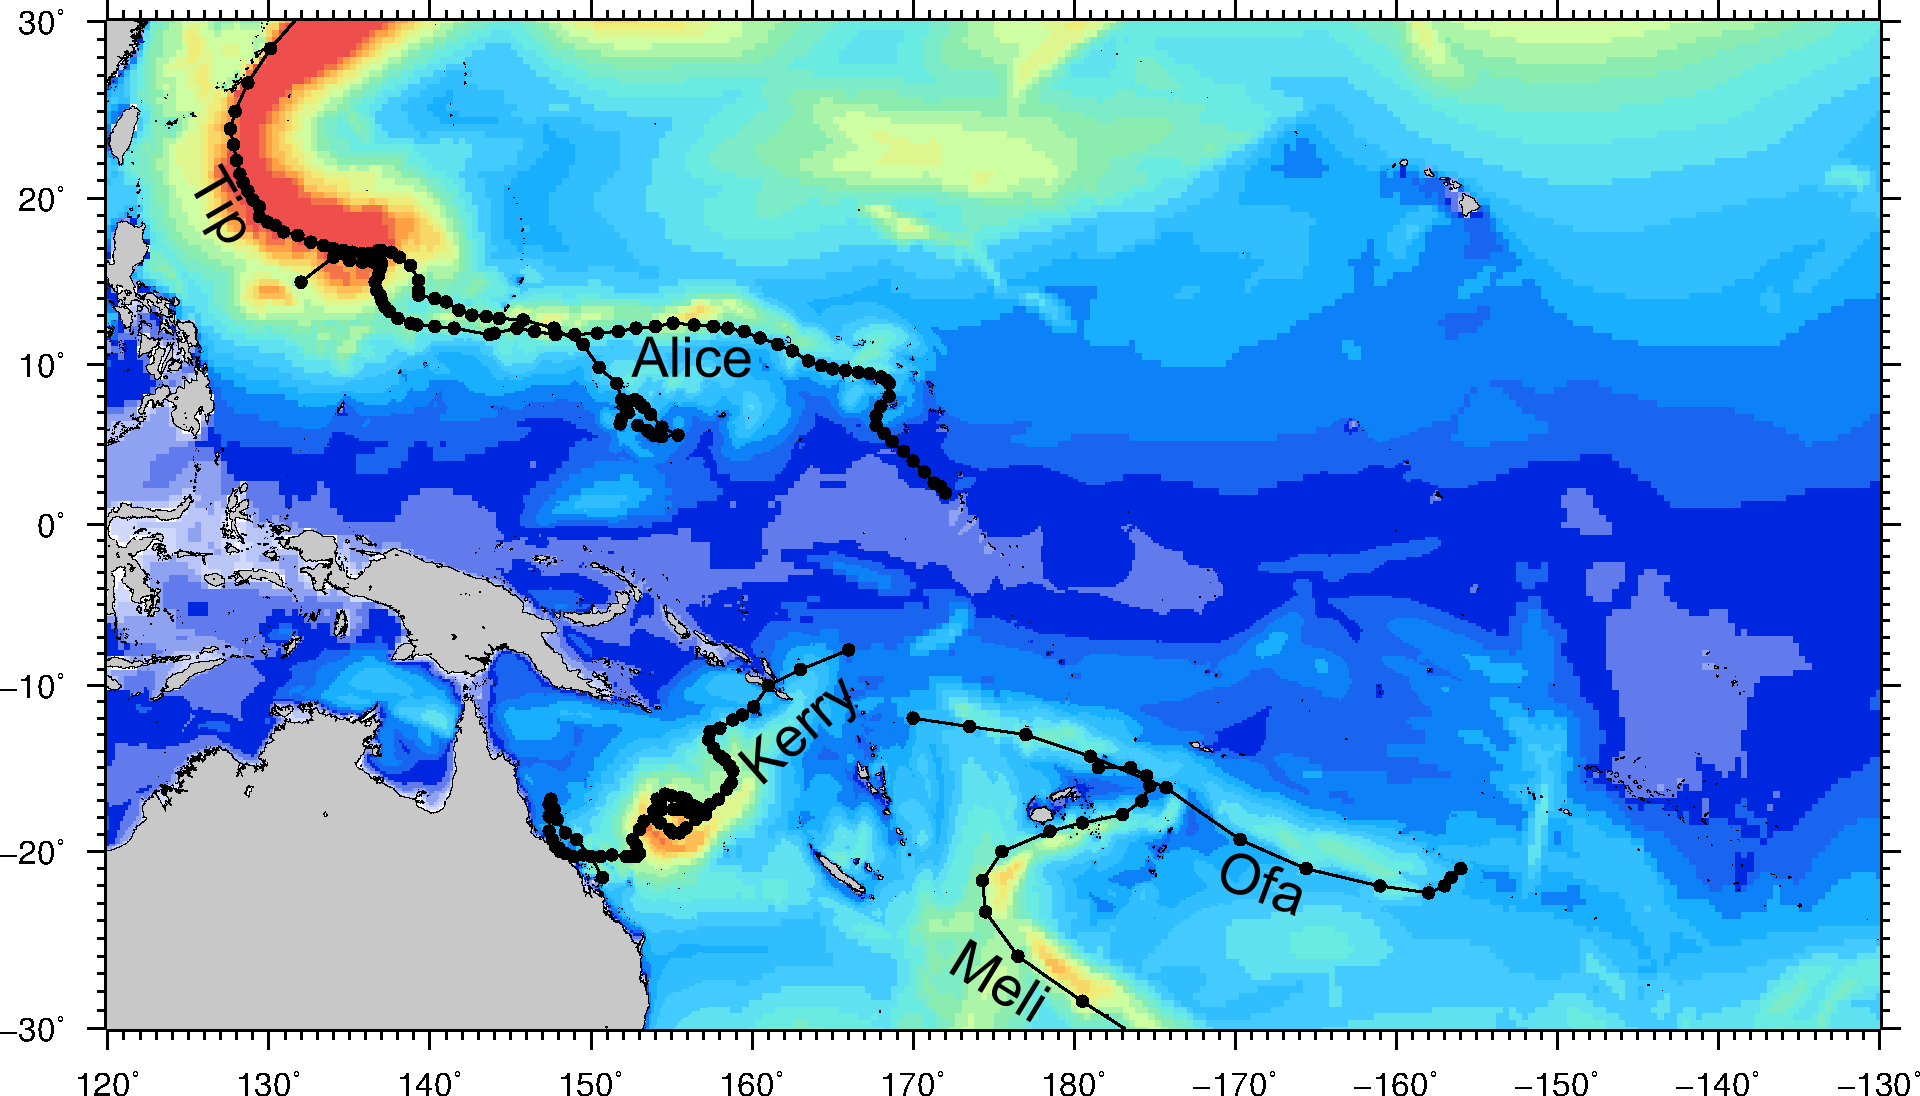
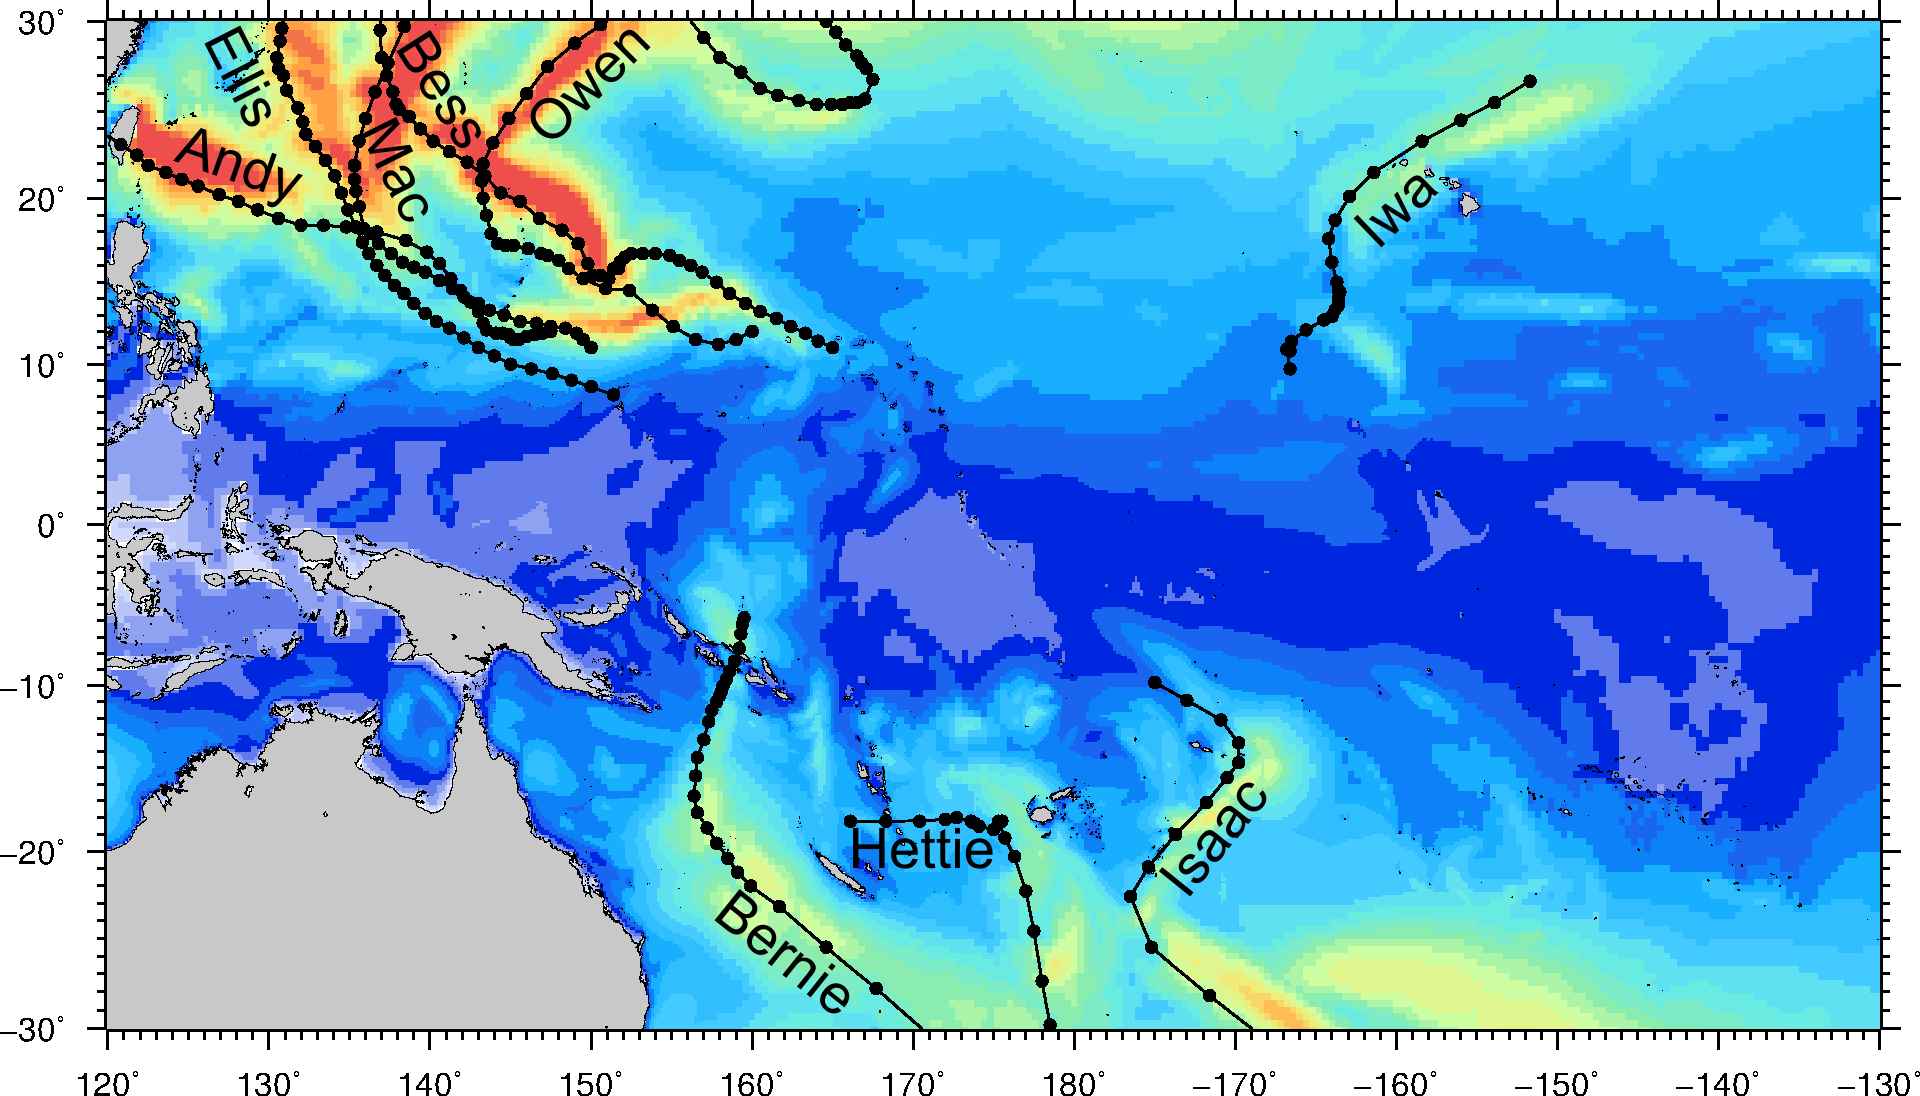
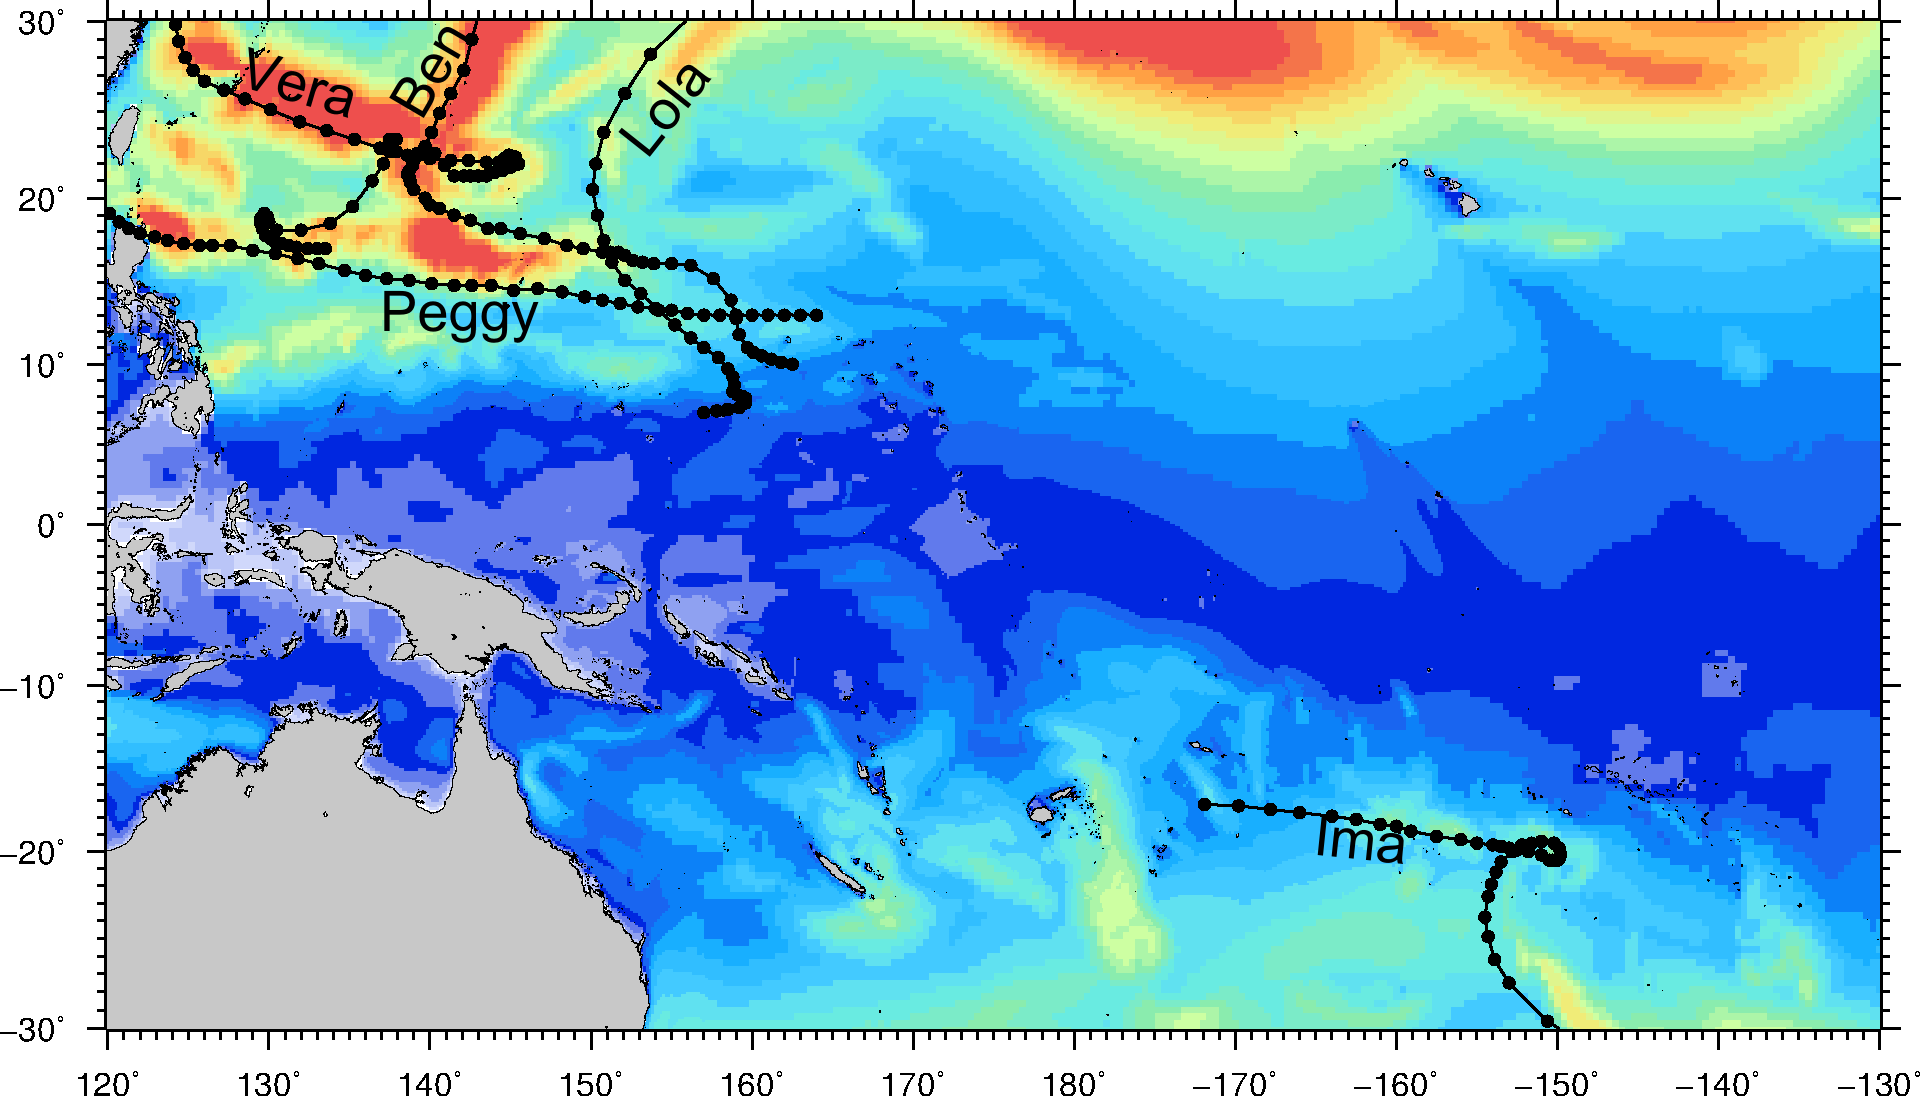
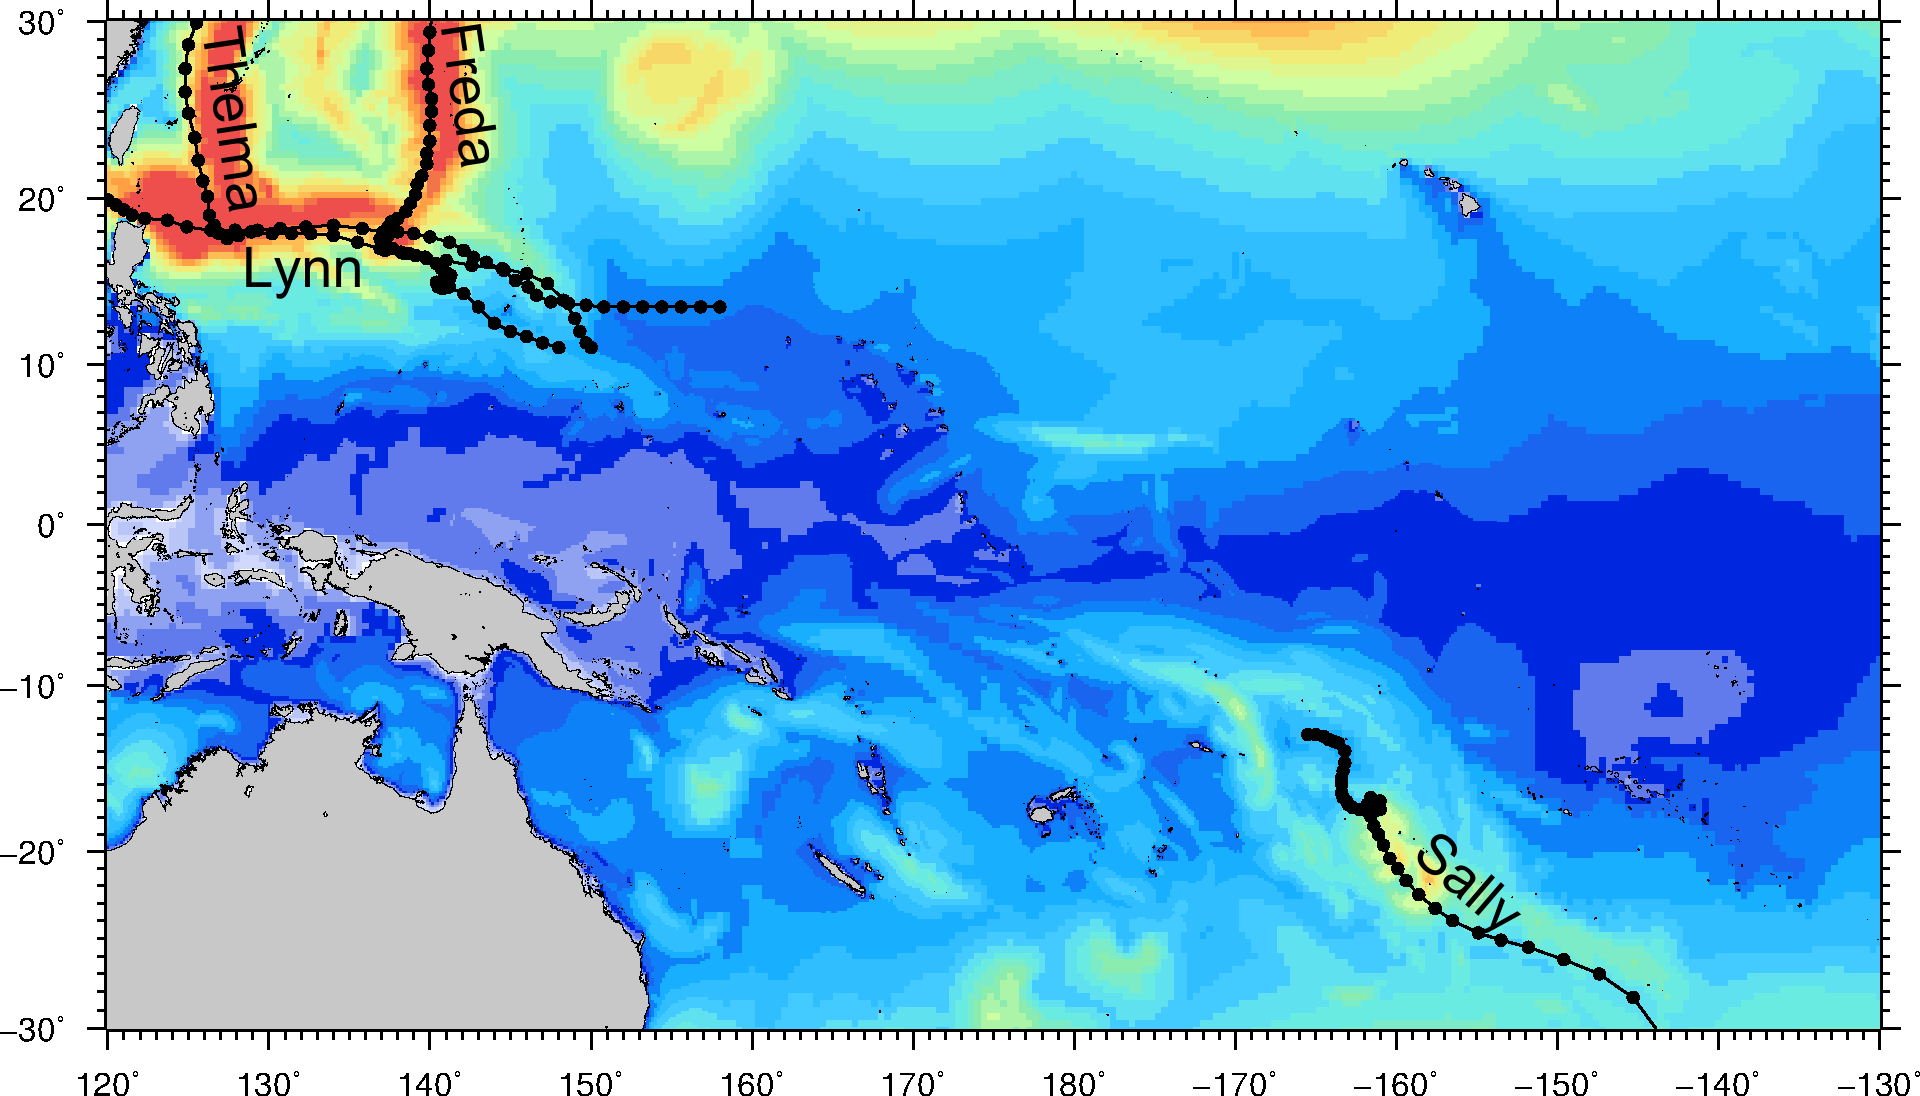
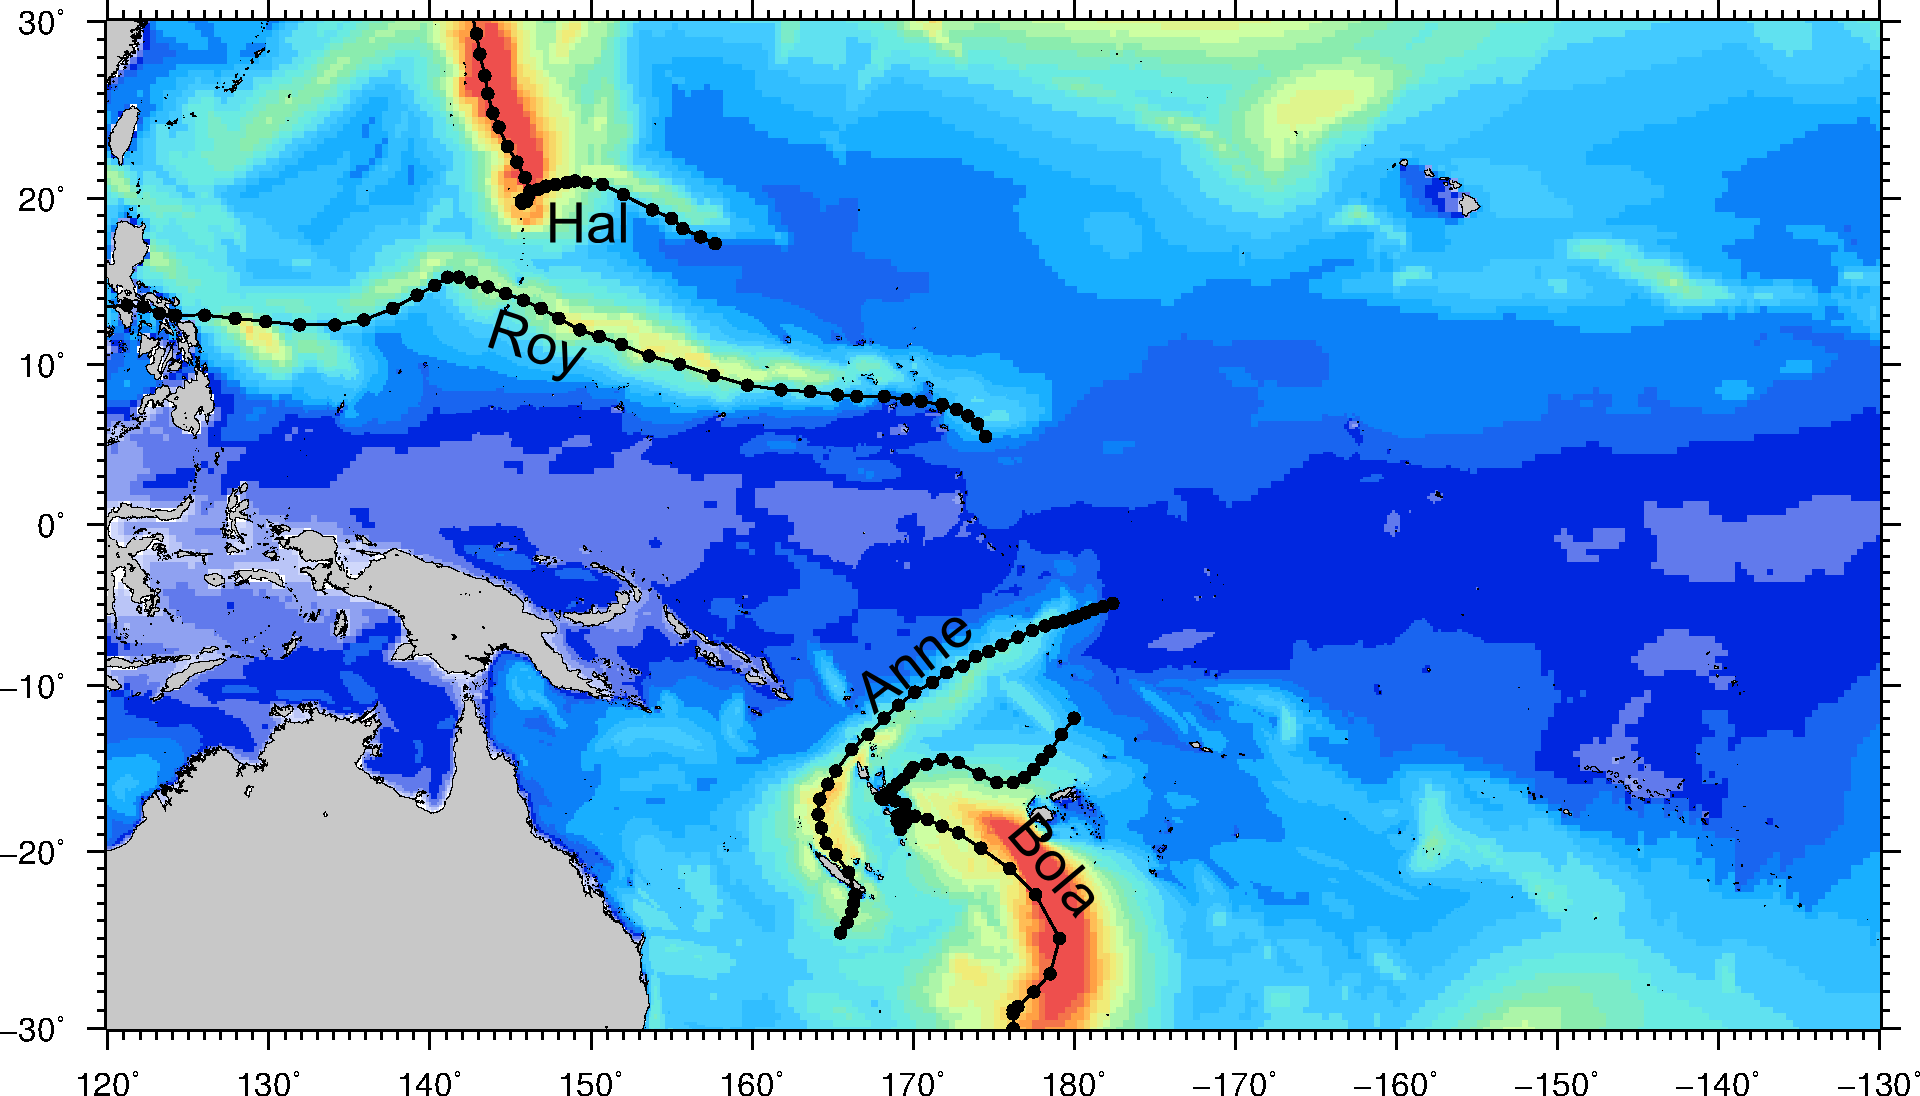
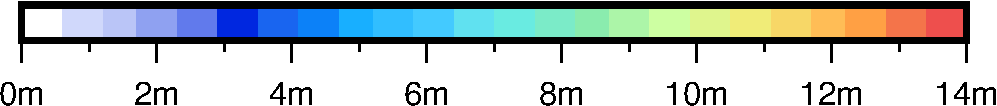
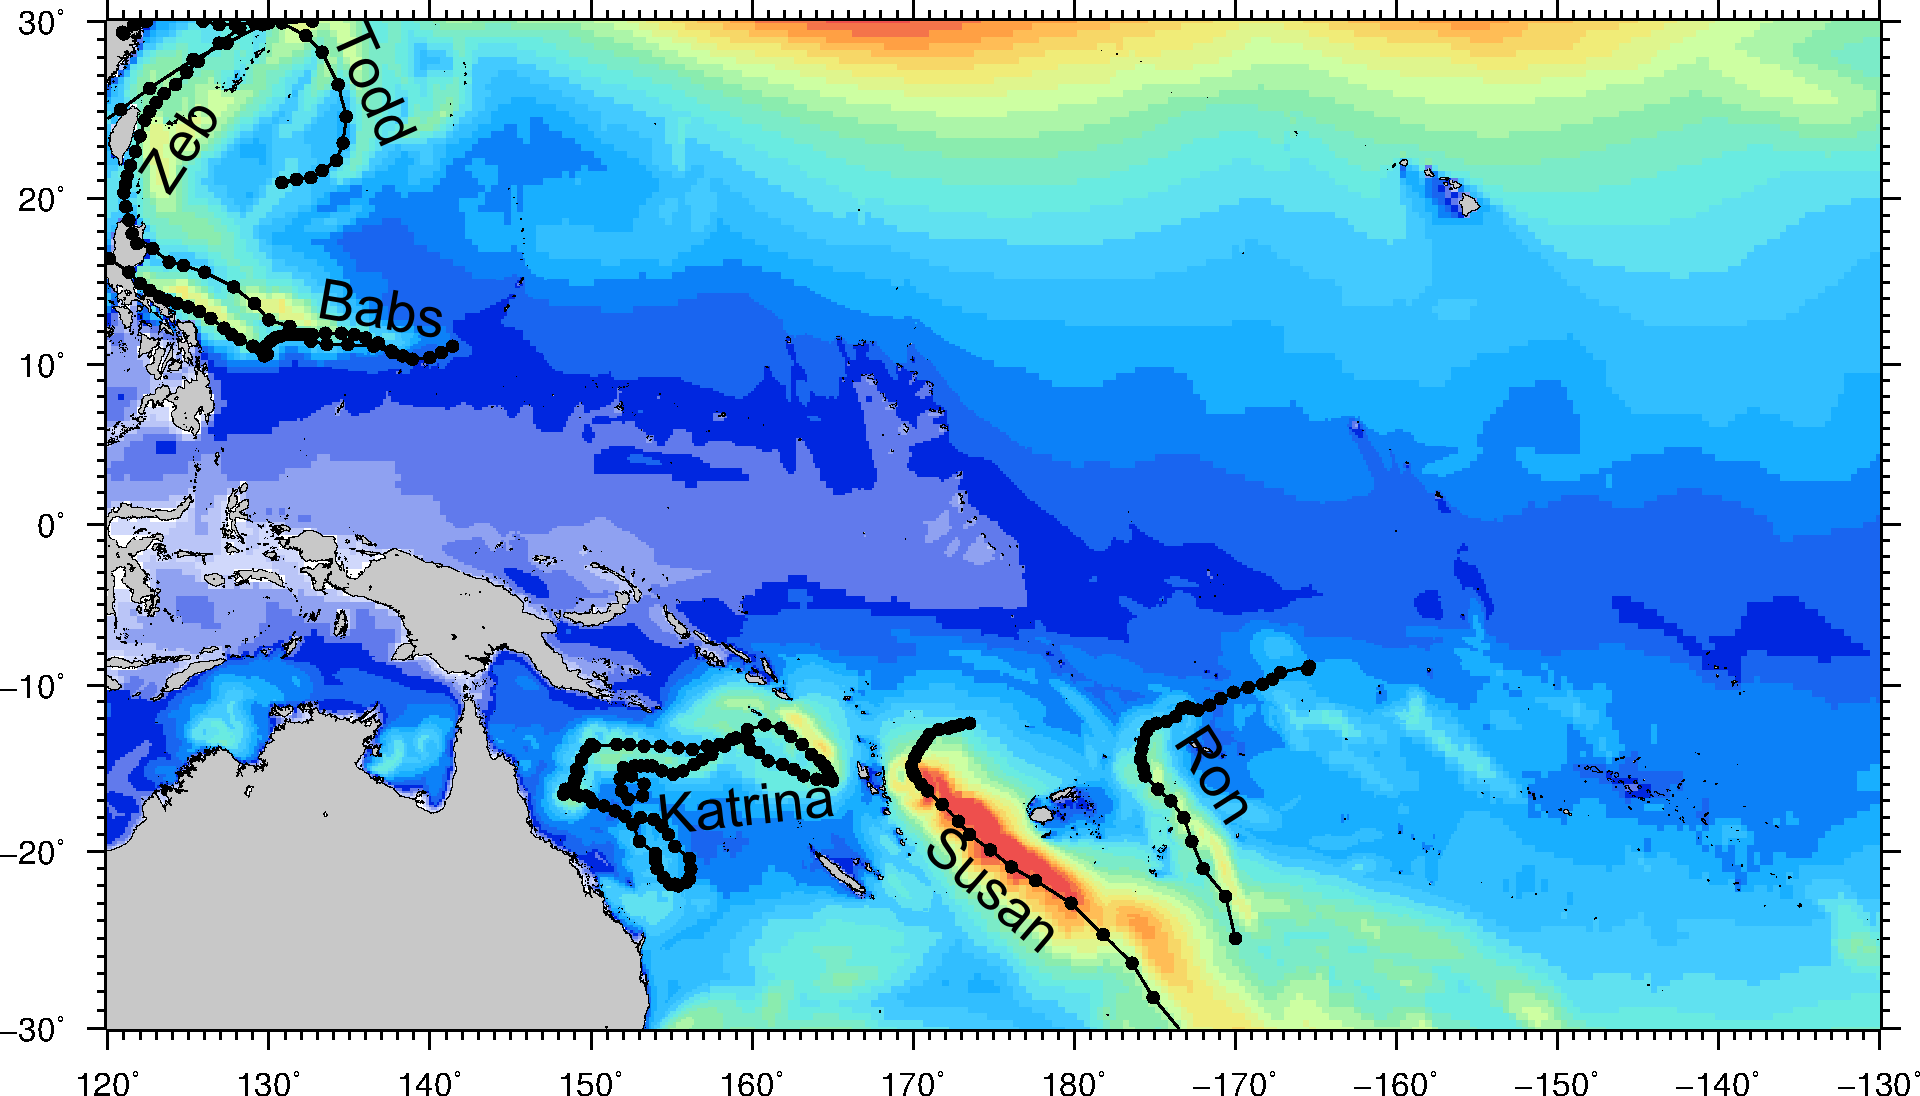
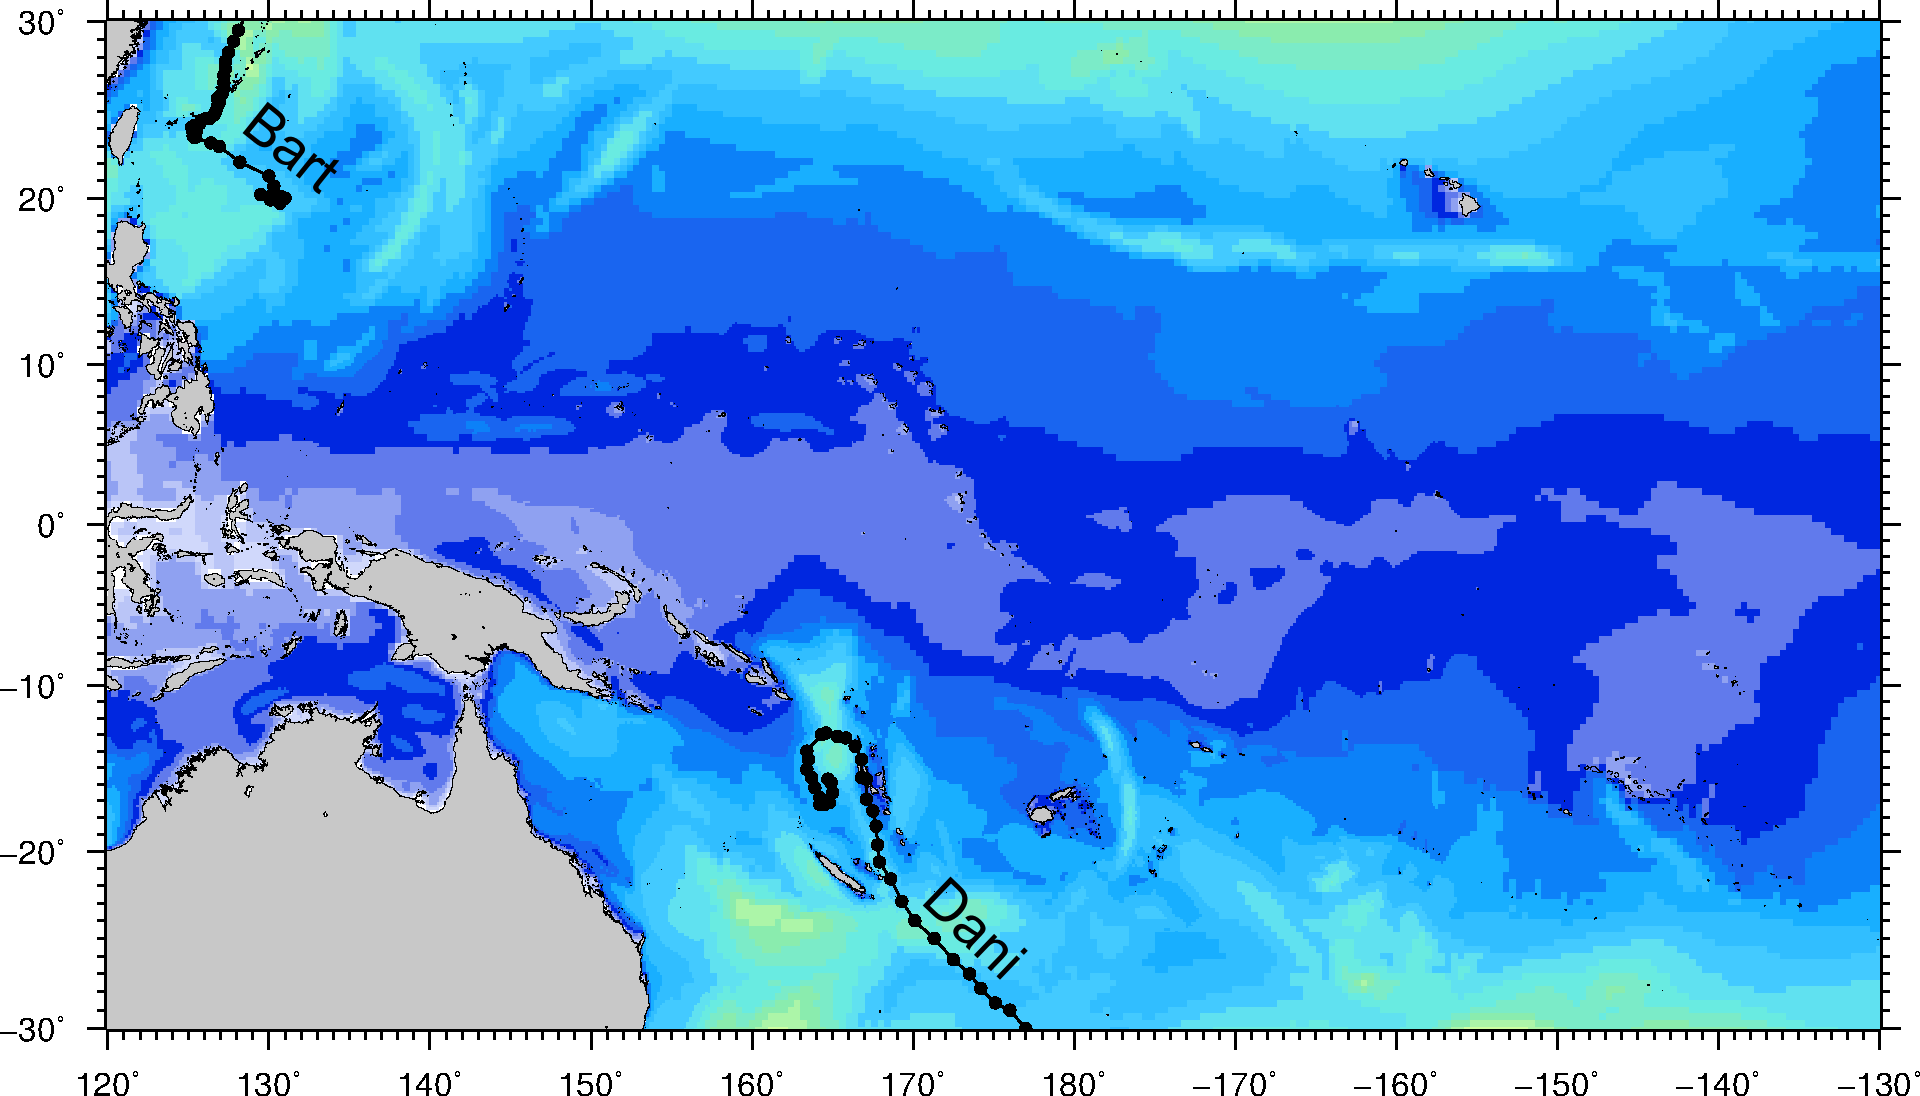
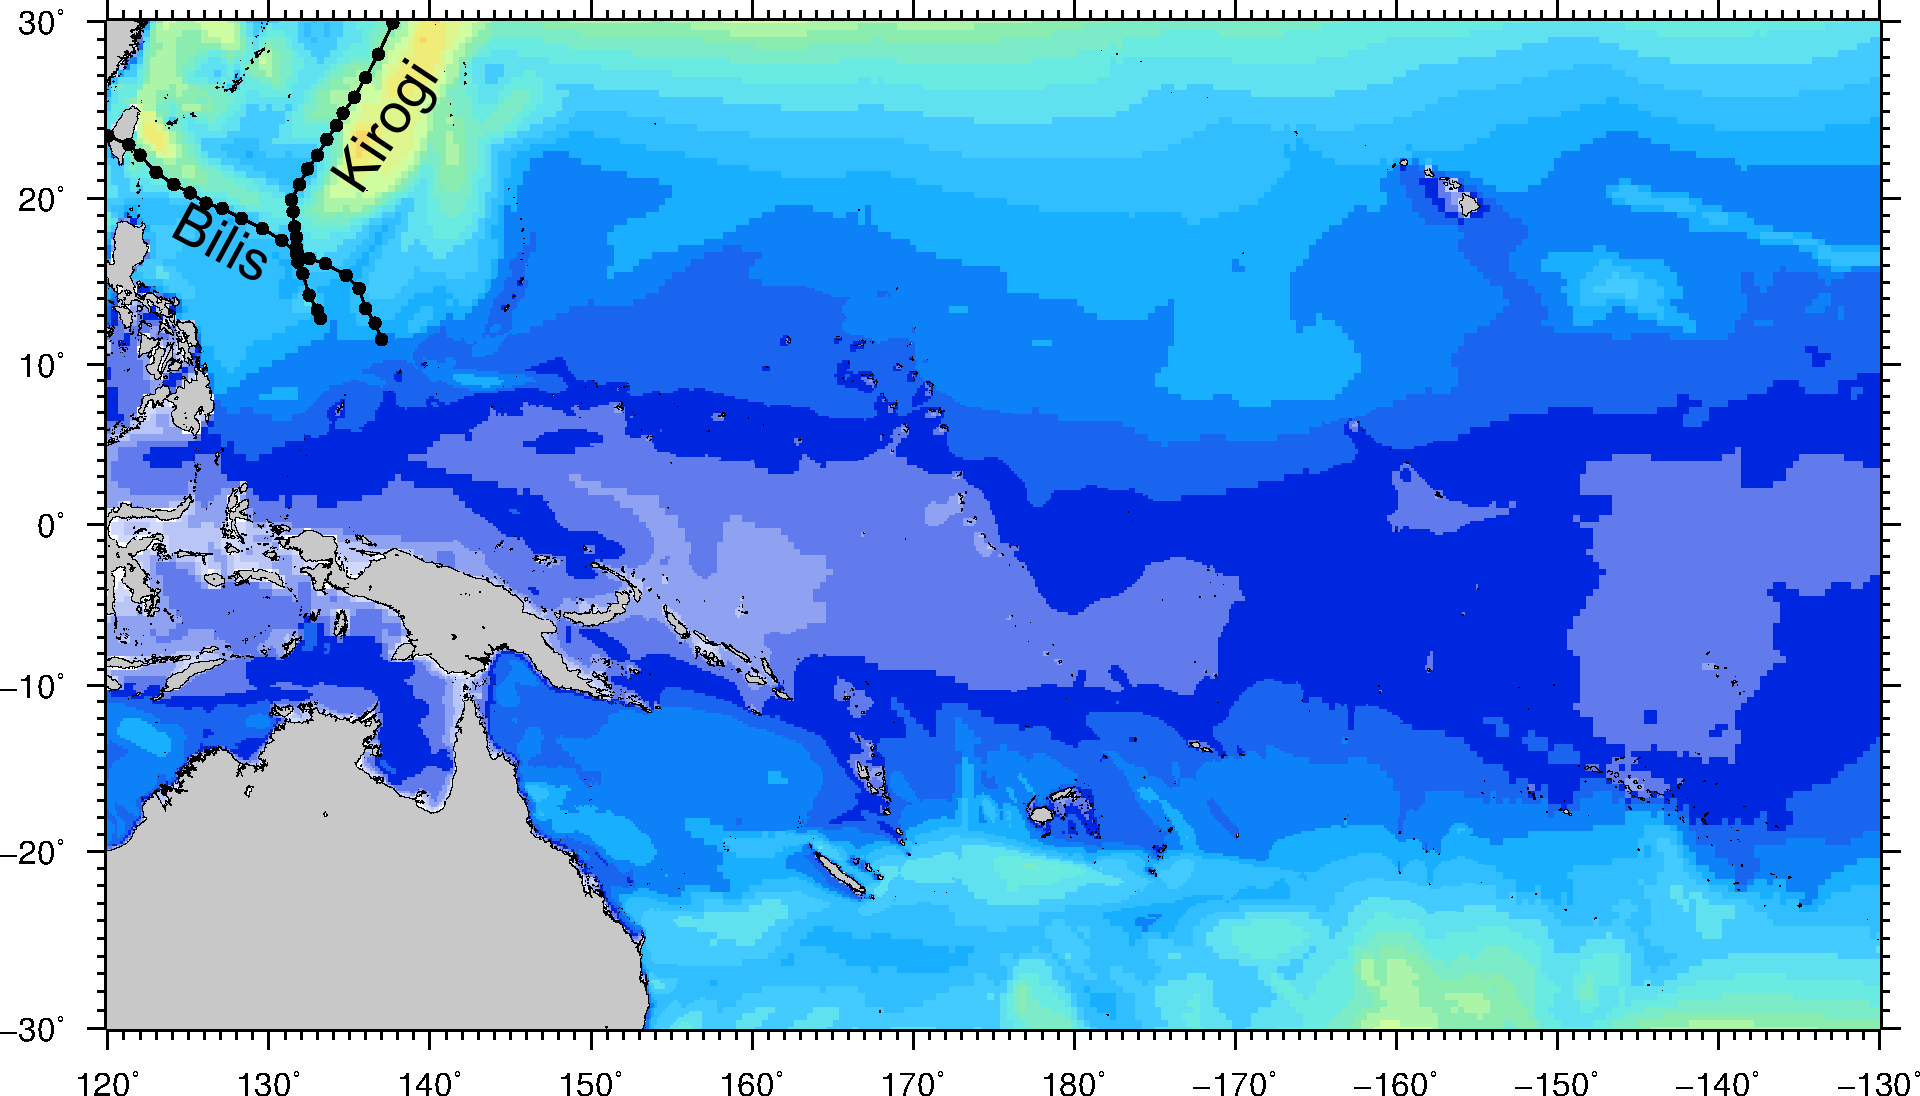
Significant wave height [m]
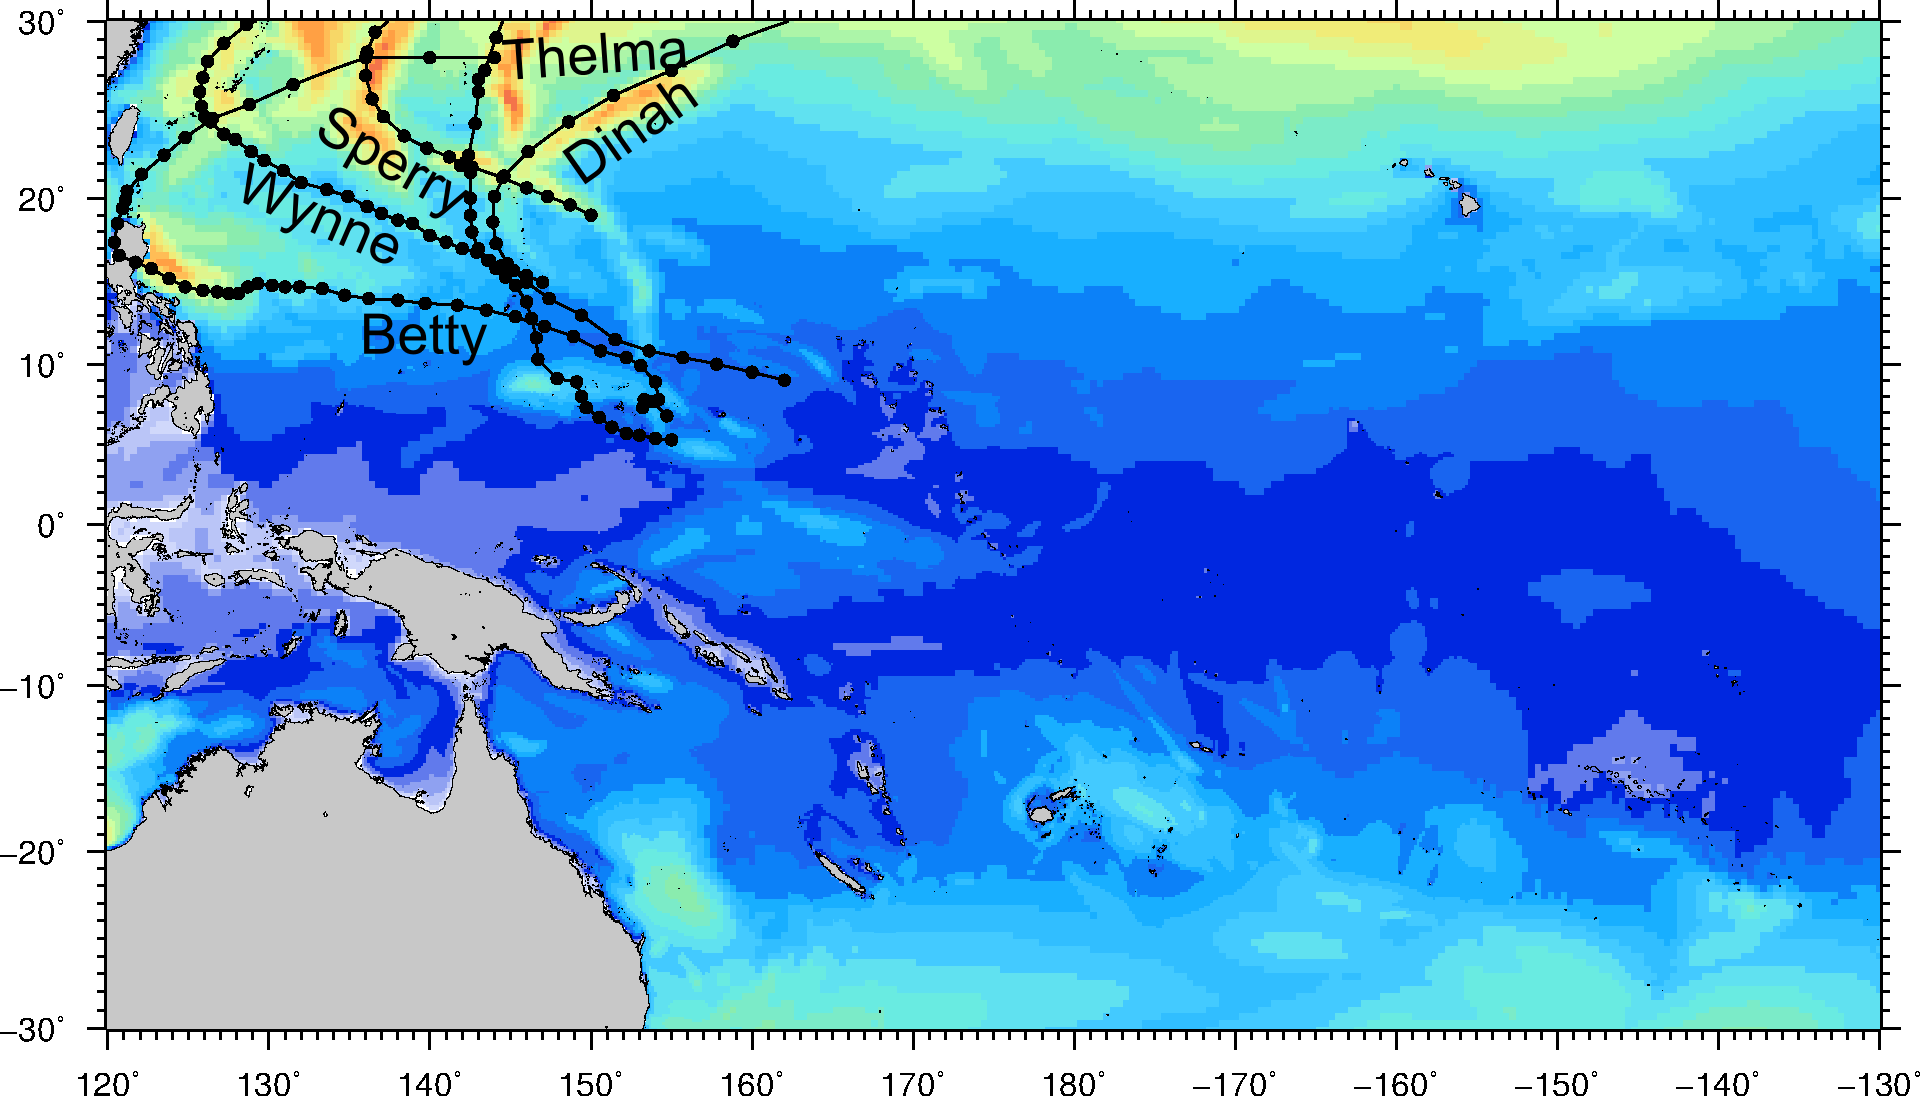
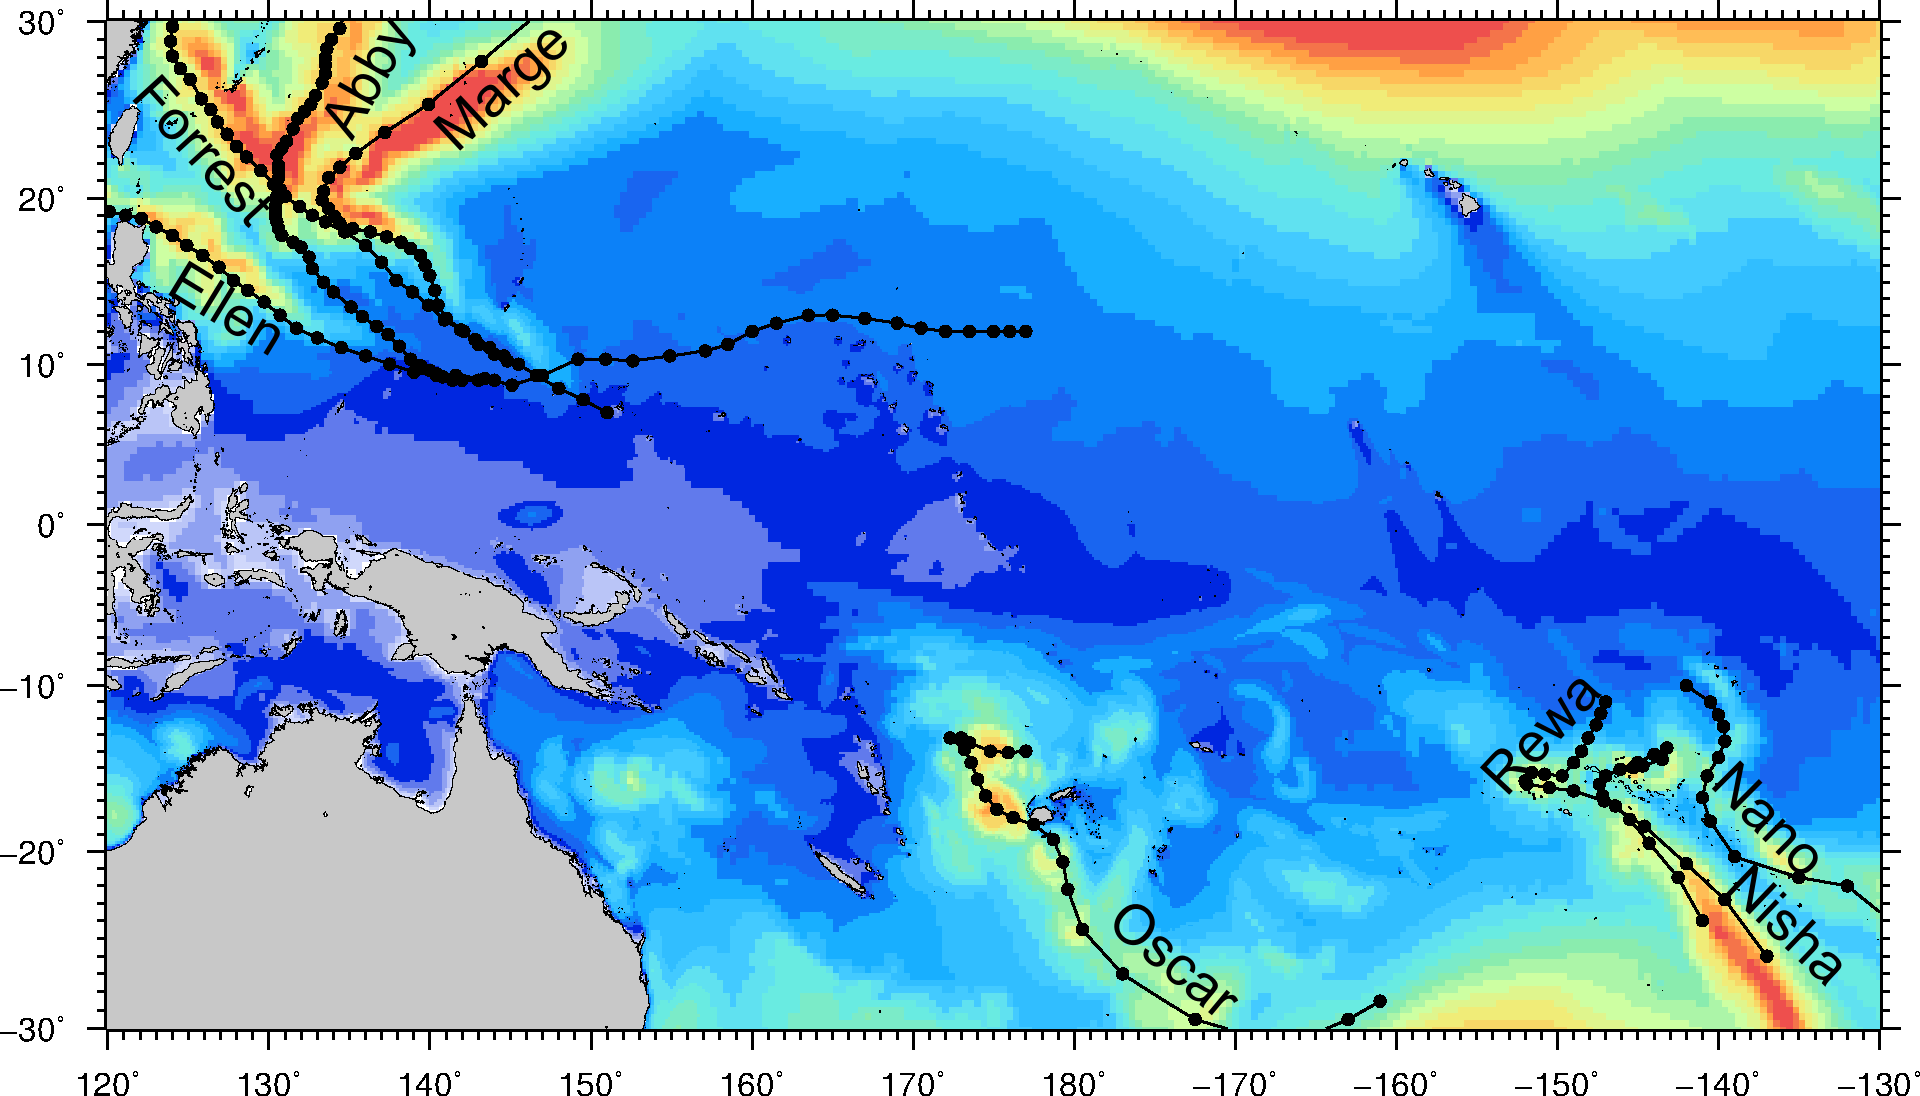
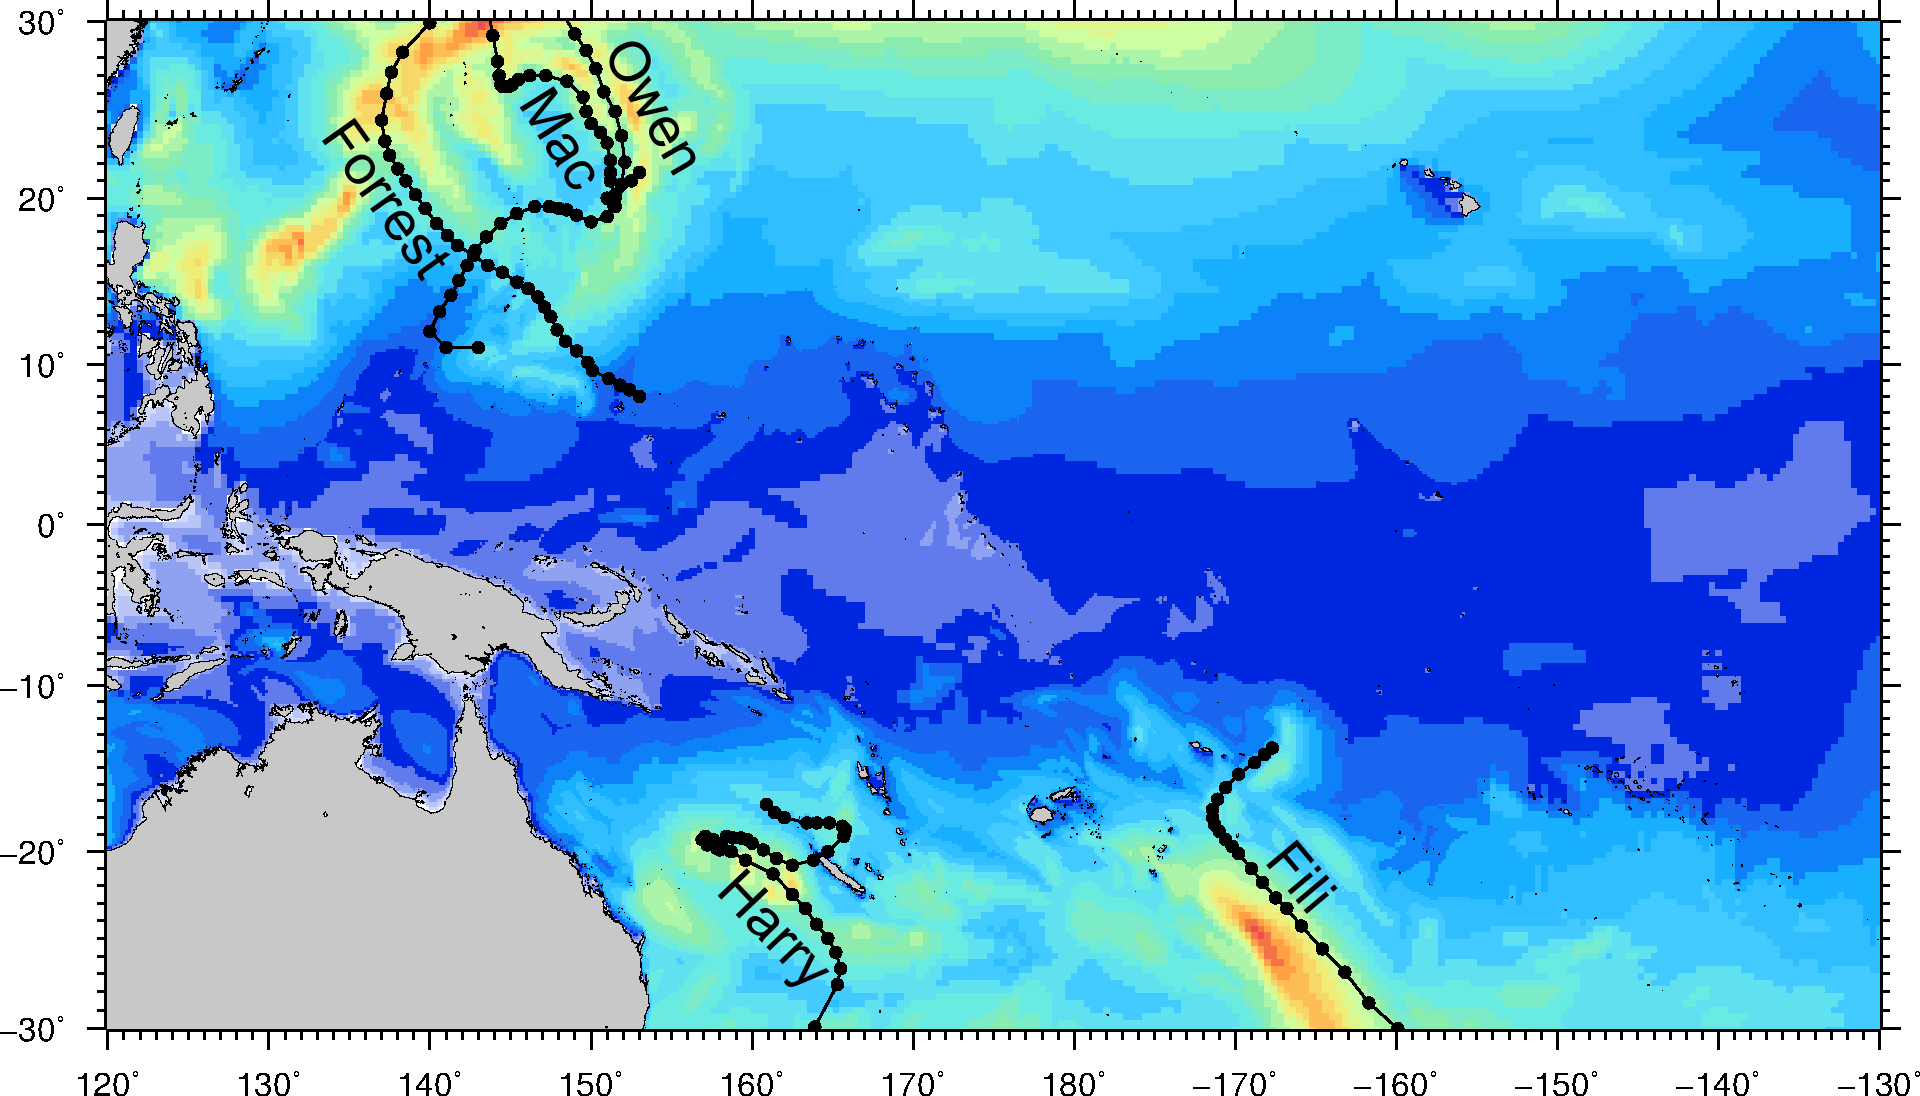
1990 - 2000
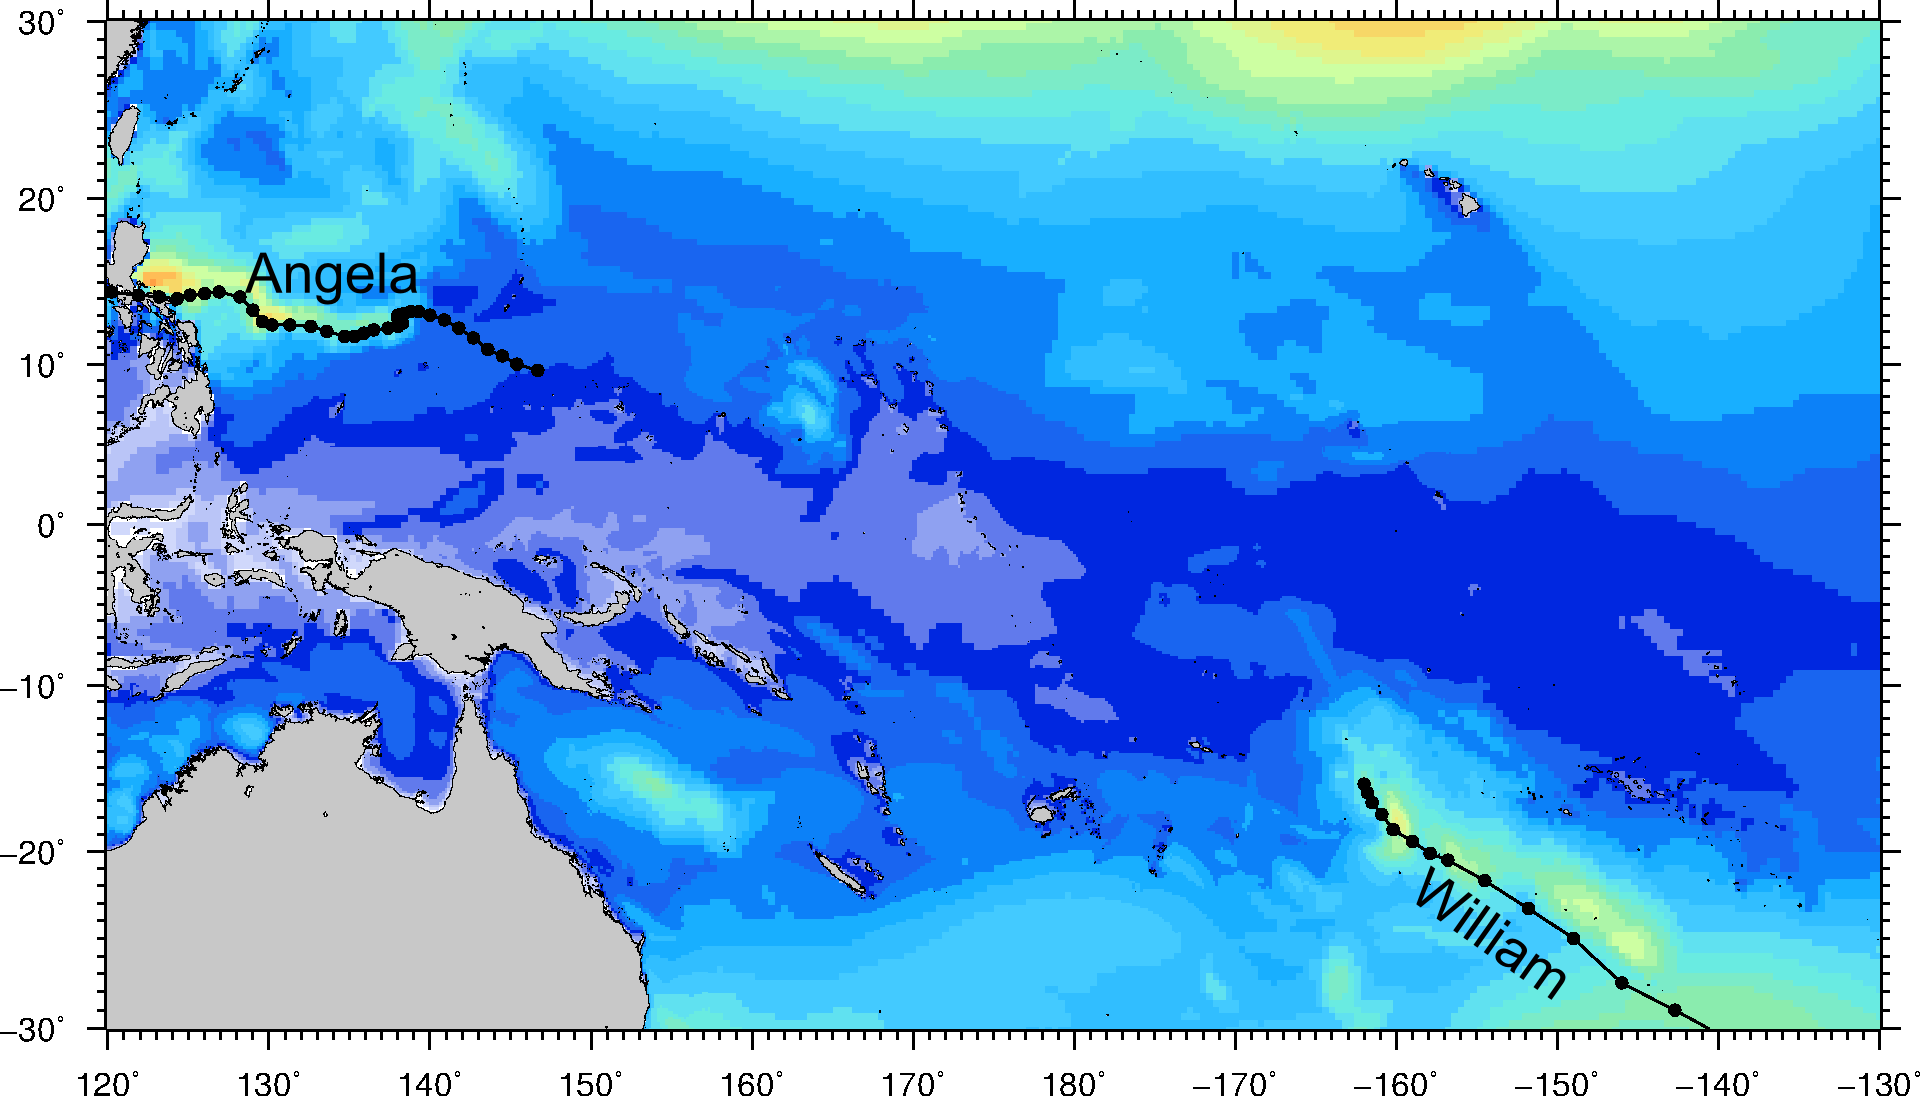
The Maps below show the maximum wave height for each year between 1990 and 2000. This decade saw fewer typhoons than the previous. However, the strong El Nino of 1997-1998 saw one of the busiest Typhoon Season.
In the Southern Hemisphere, TC Ofa (1990) landed over Samoa bringing waves as high as 14m. Read more about TC Ofa here.
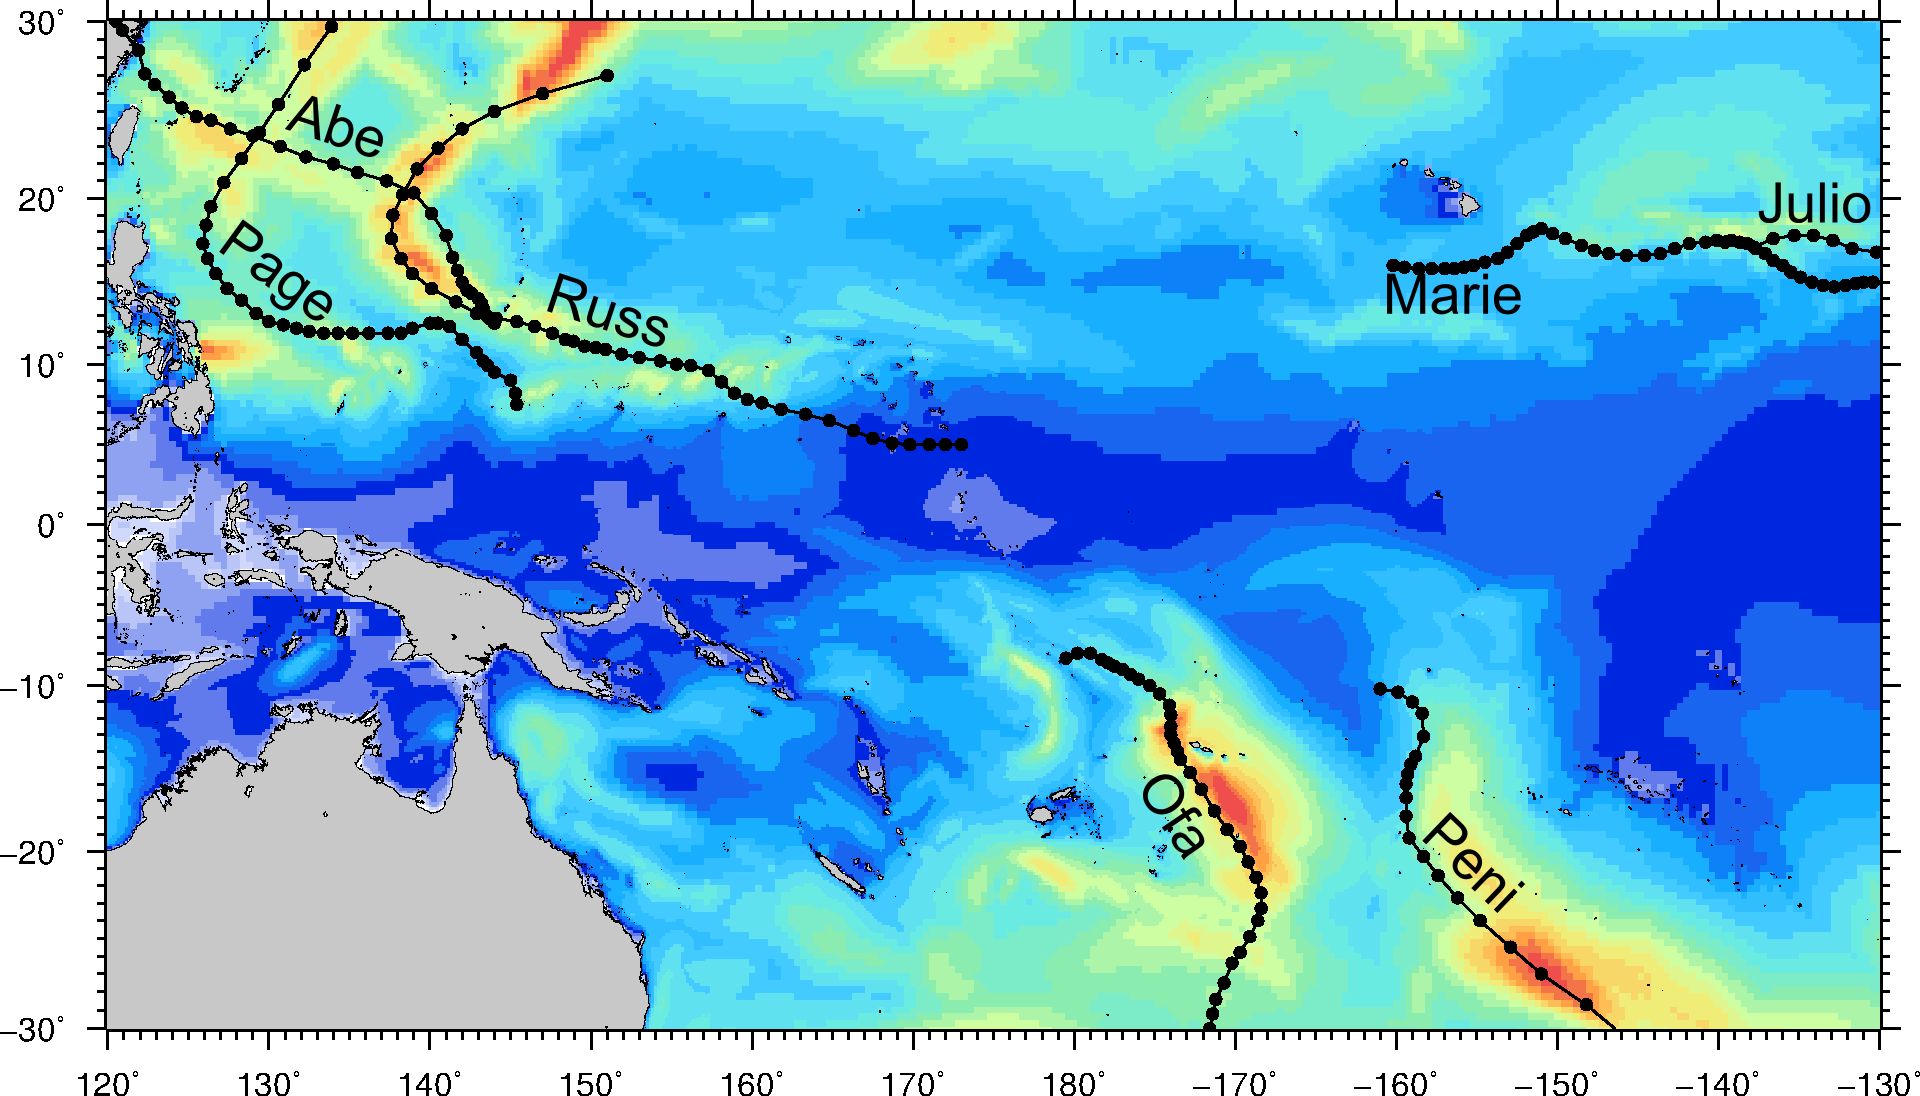
Significant wave height [m]
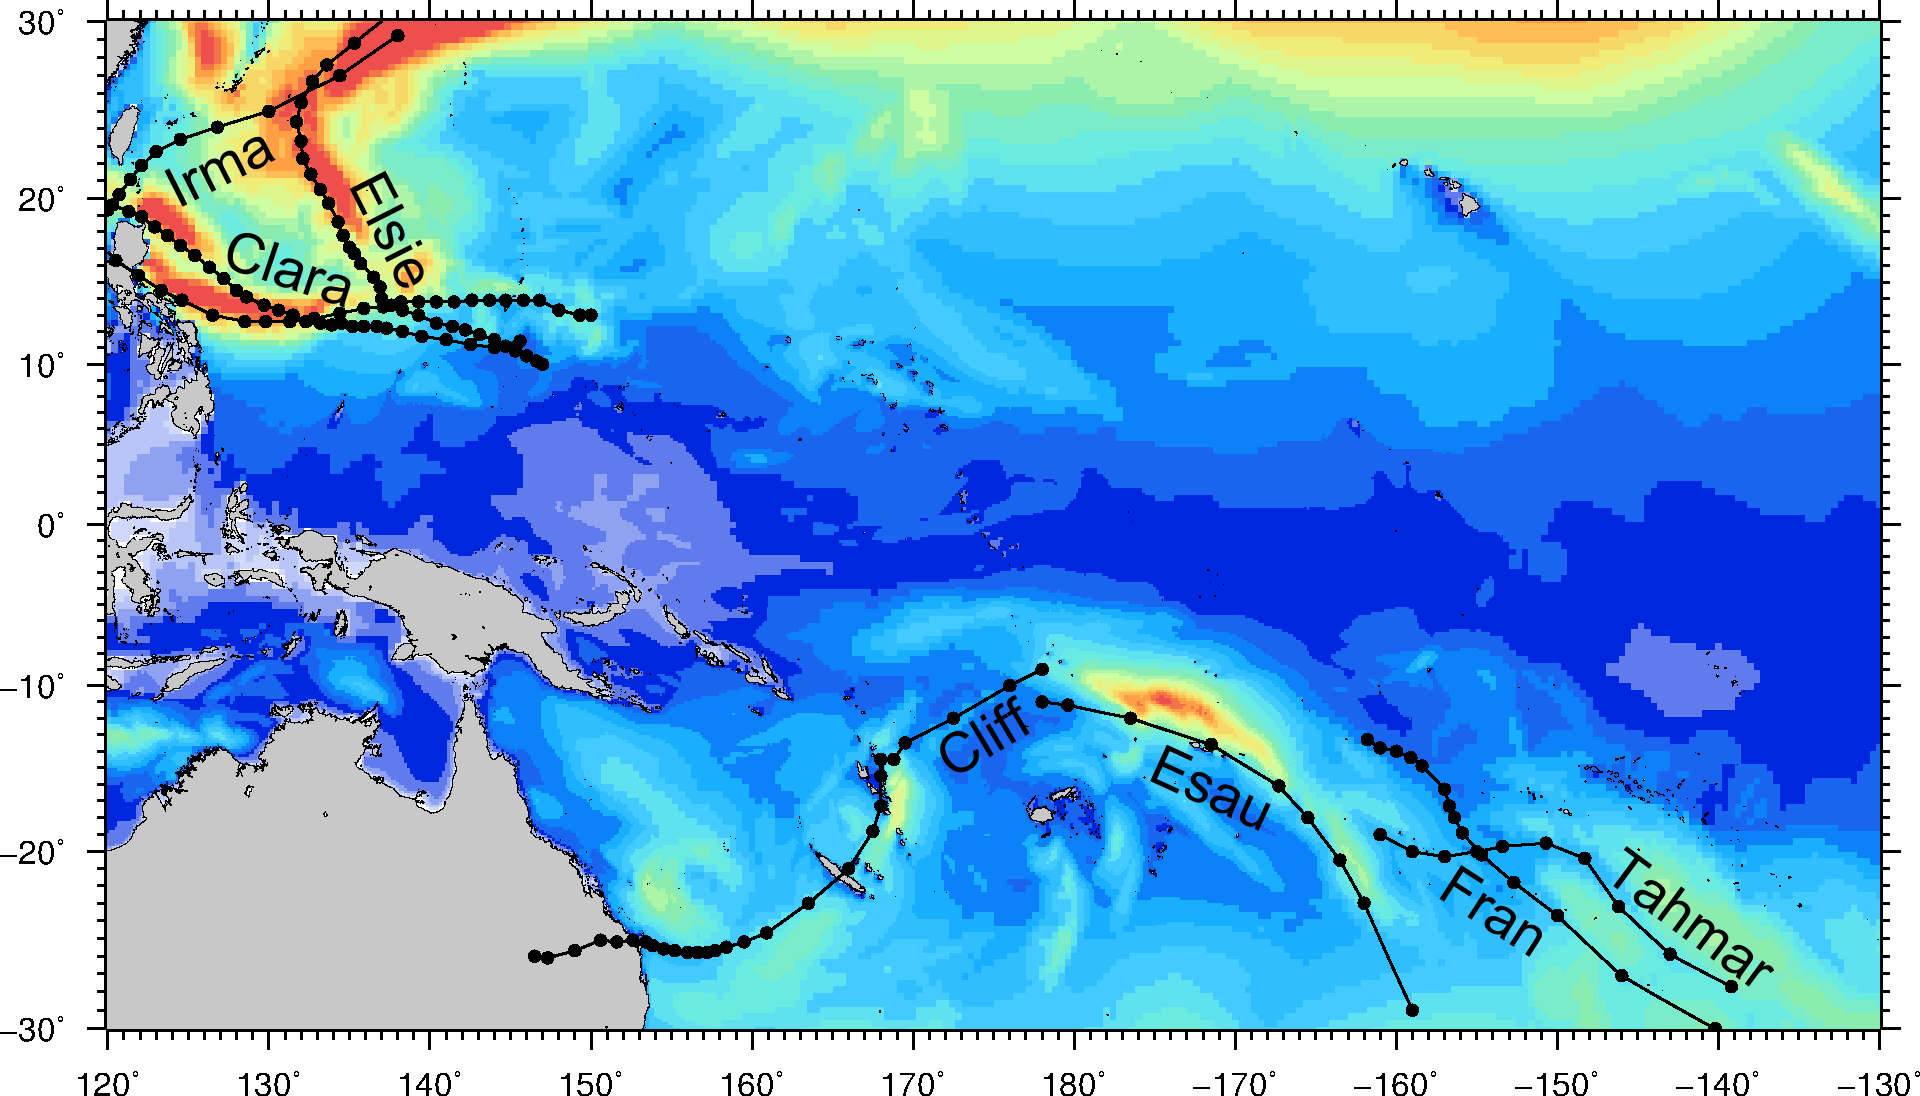
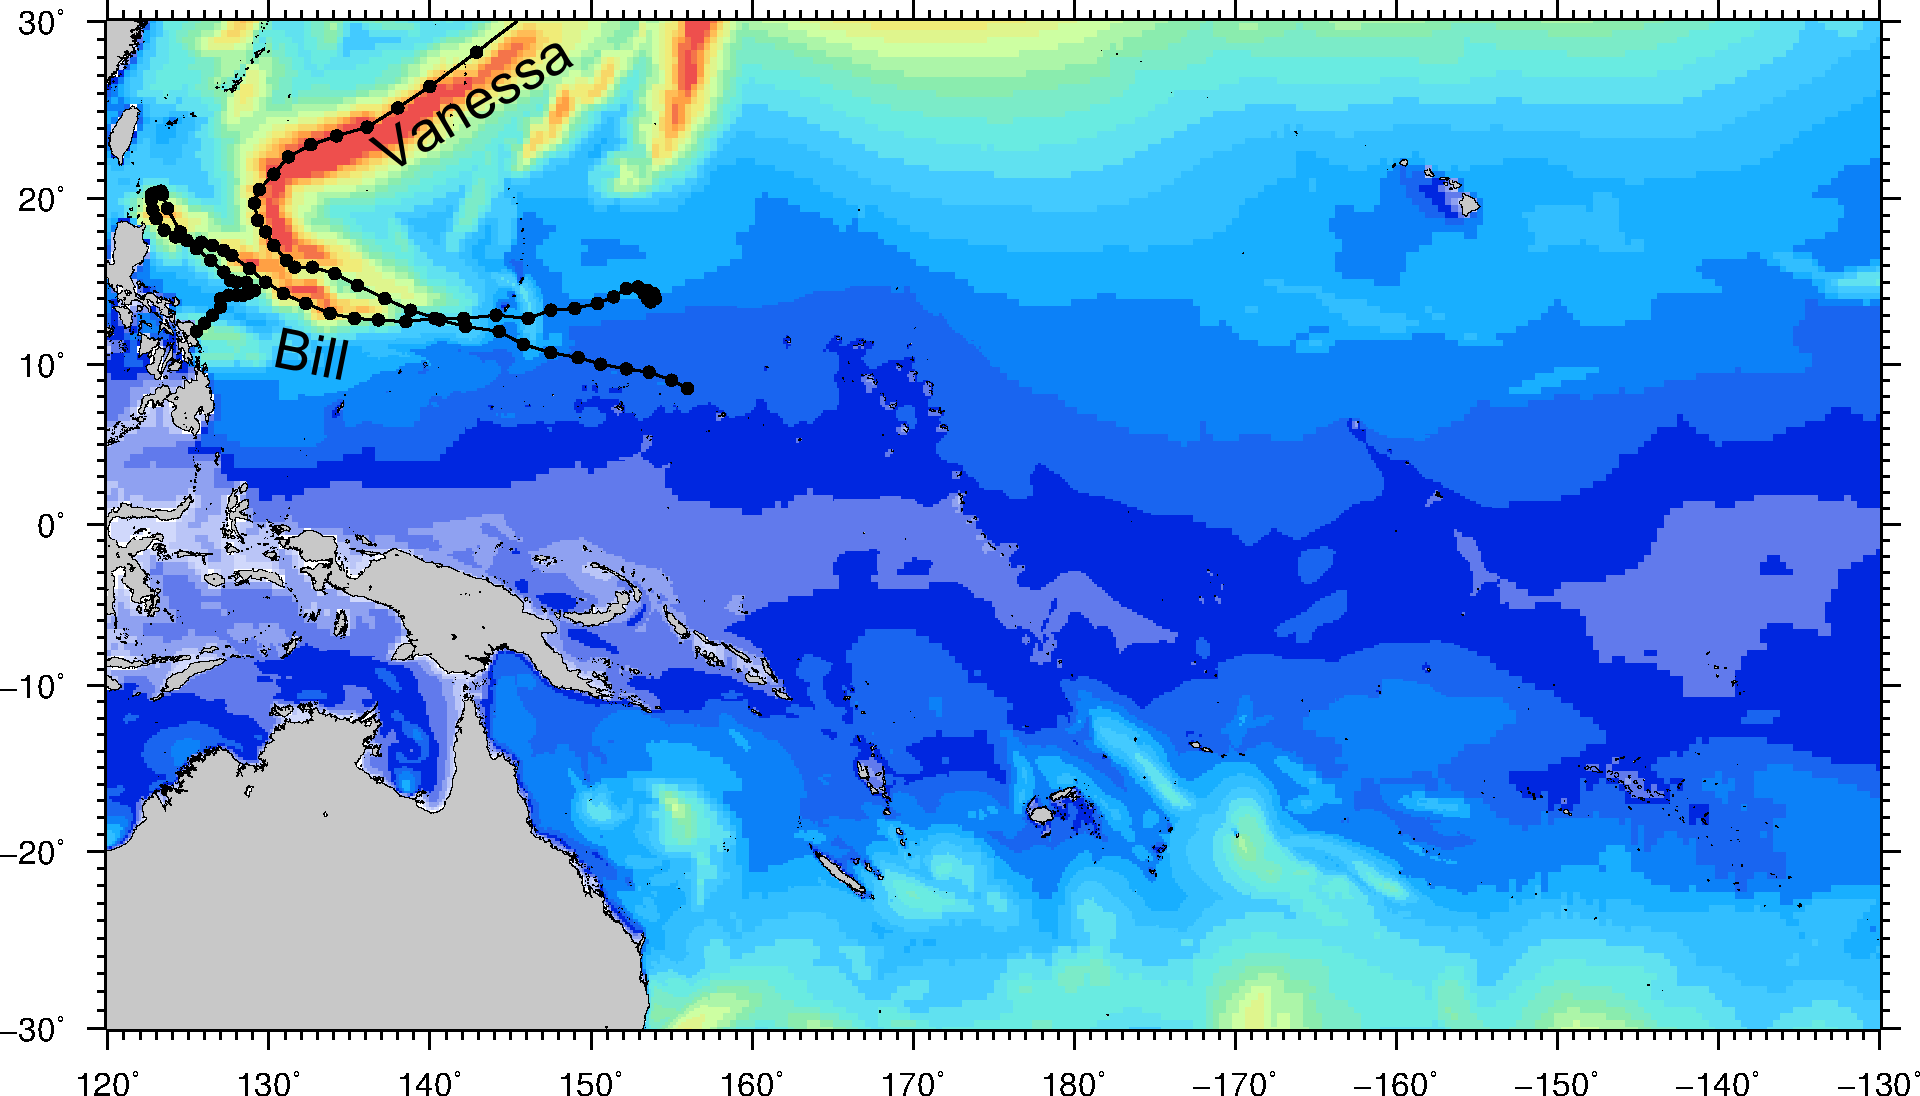
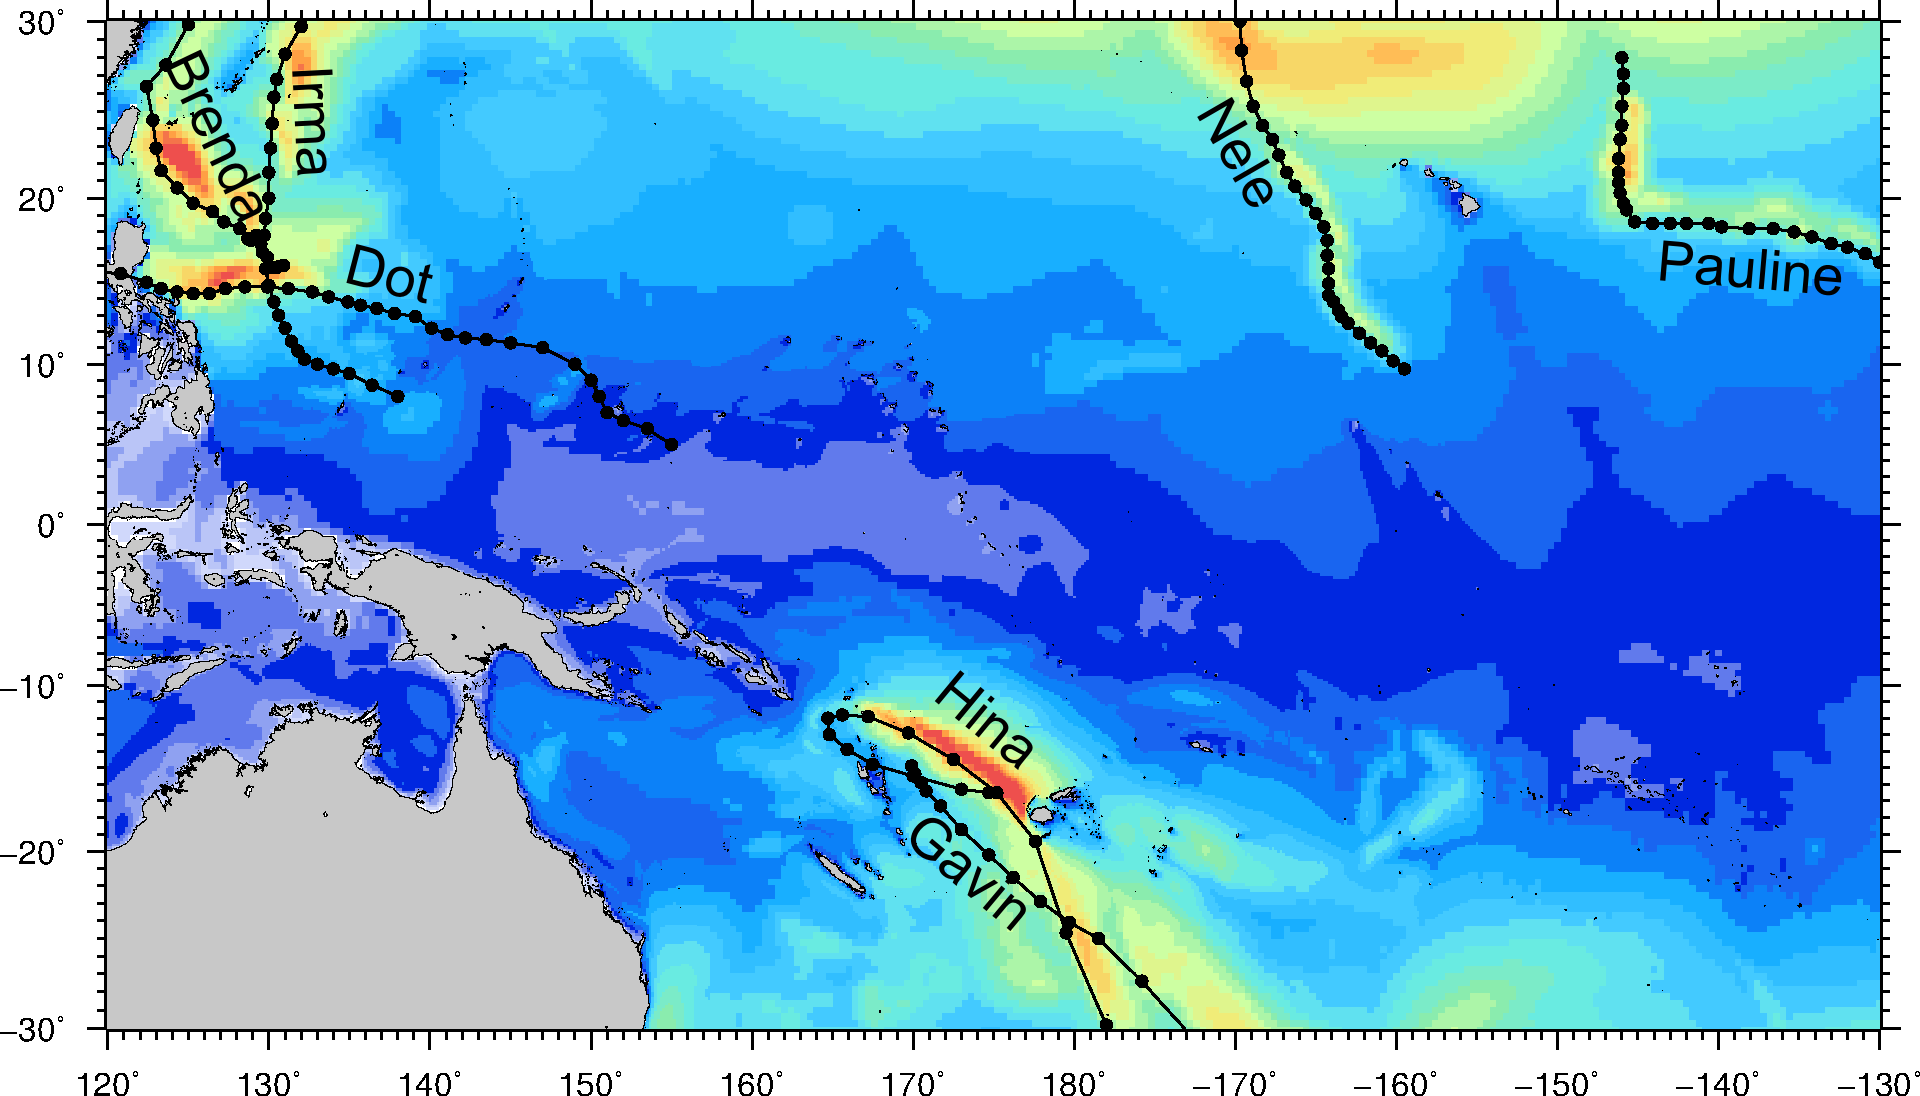
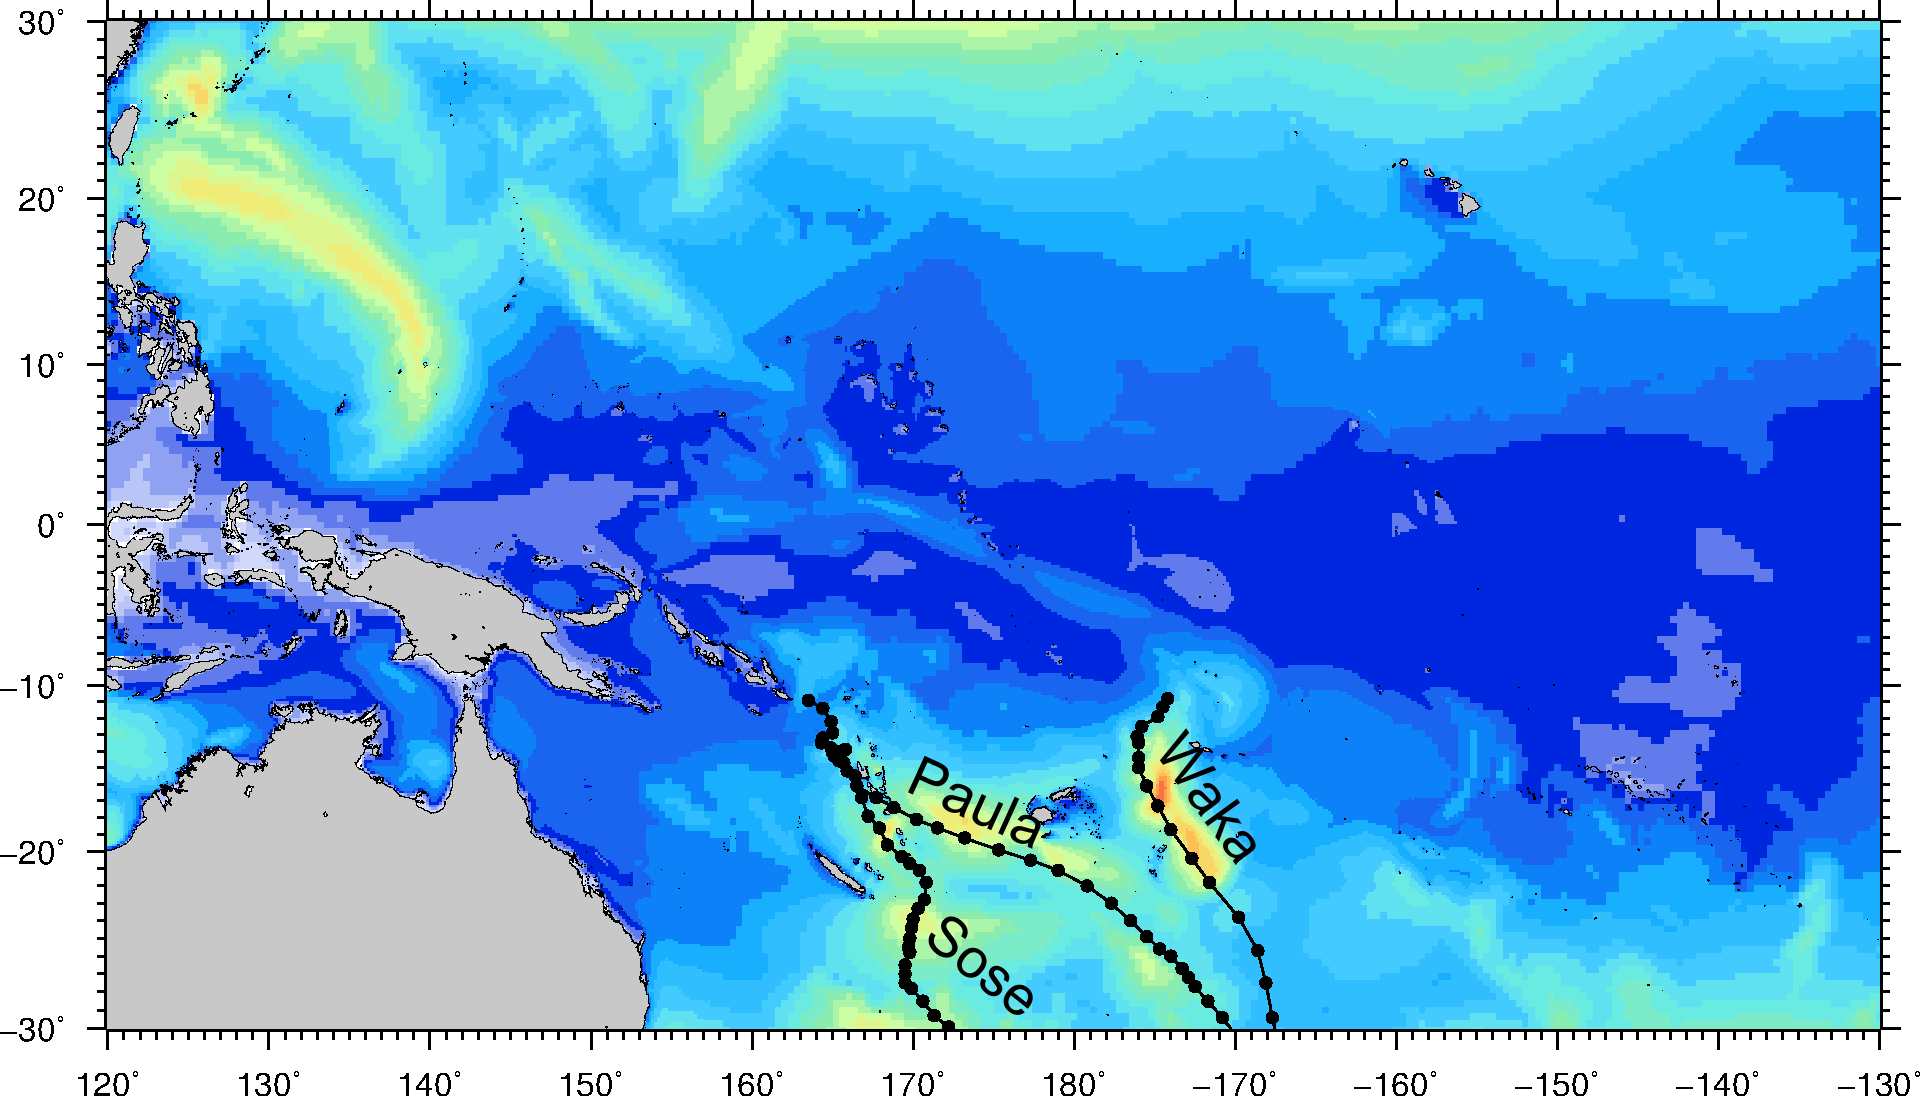
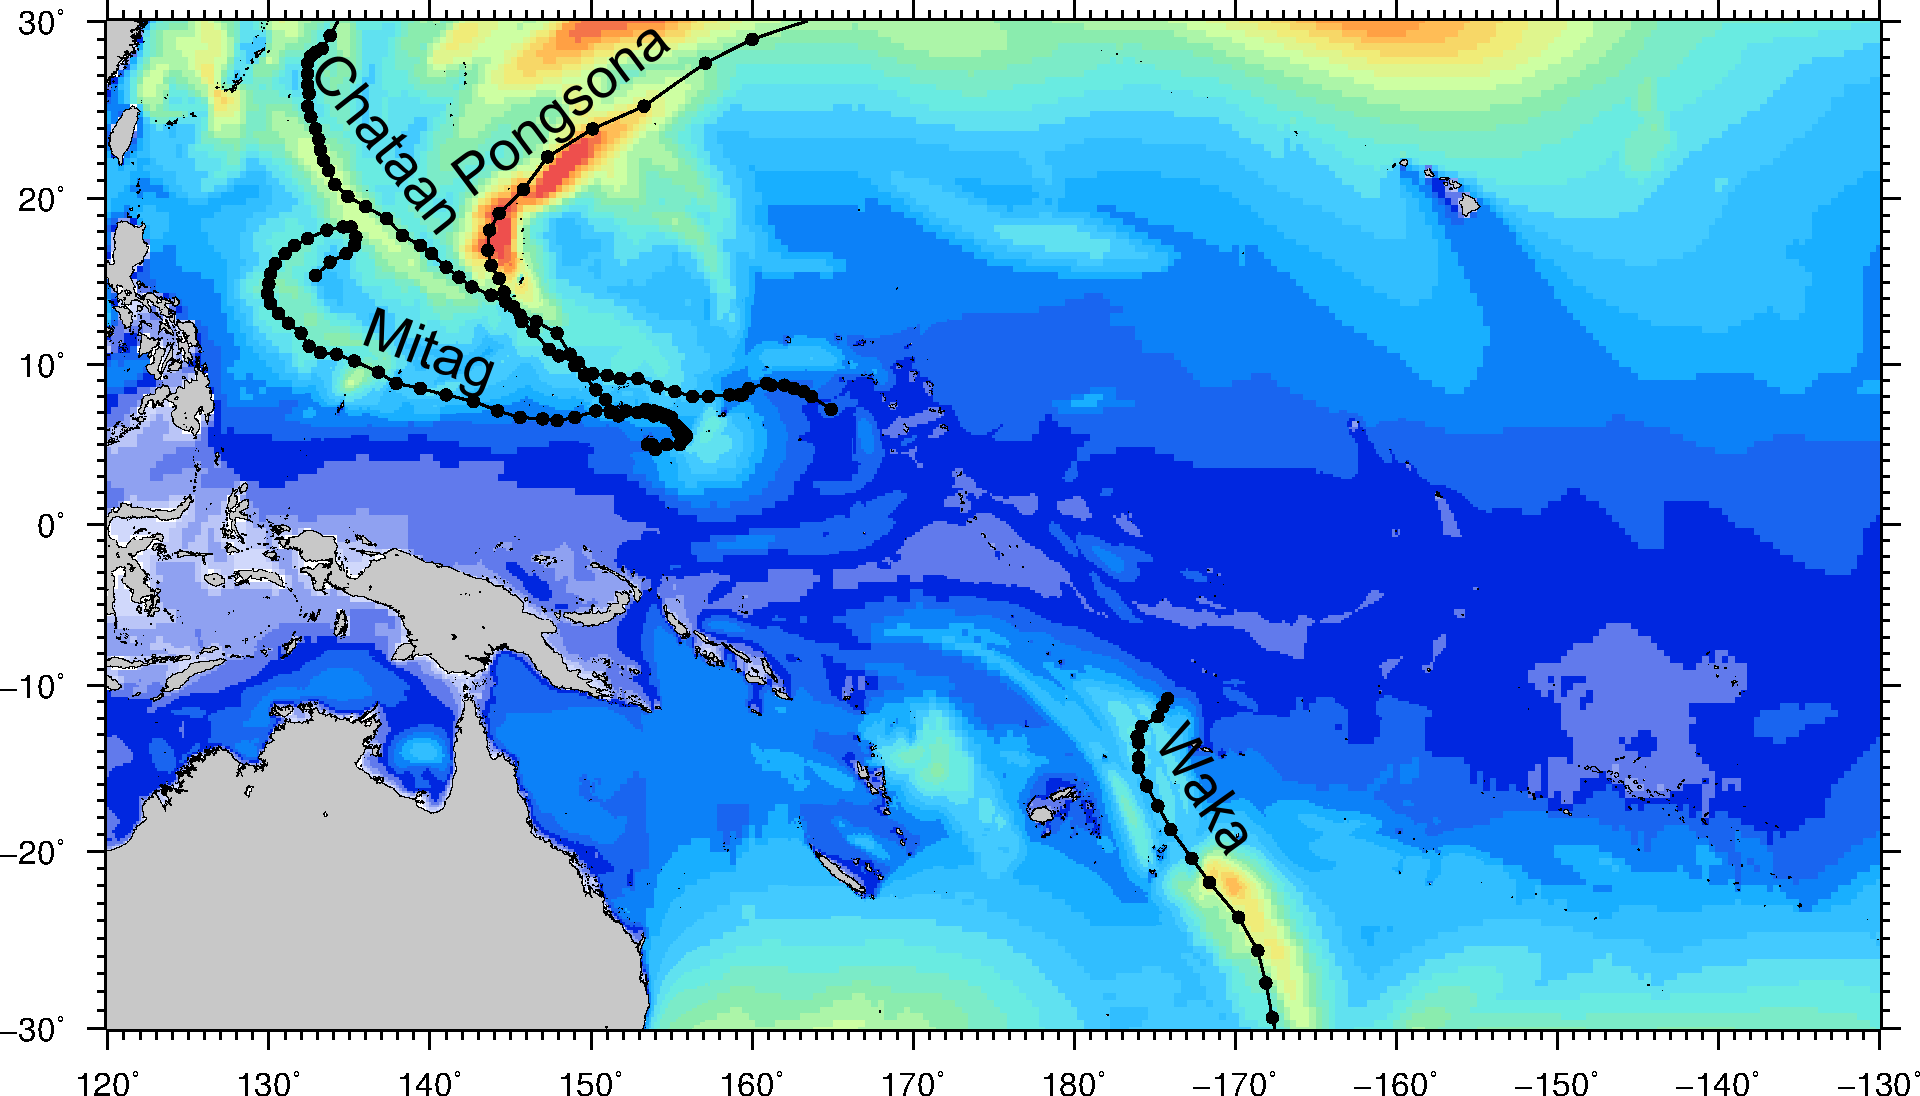
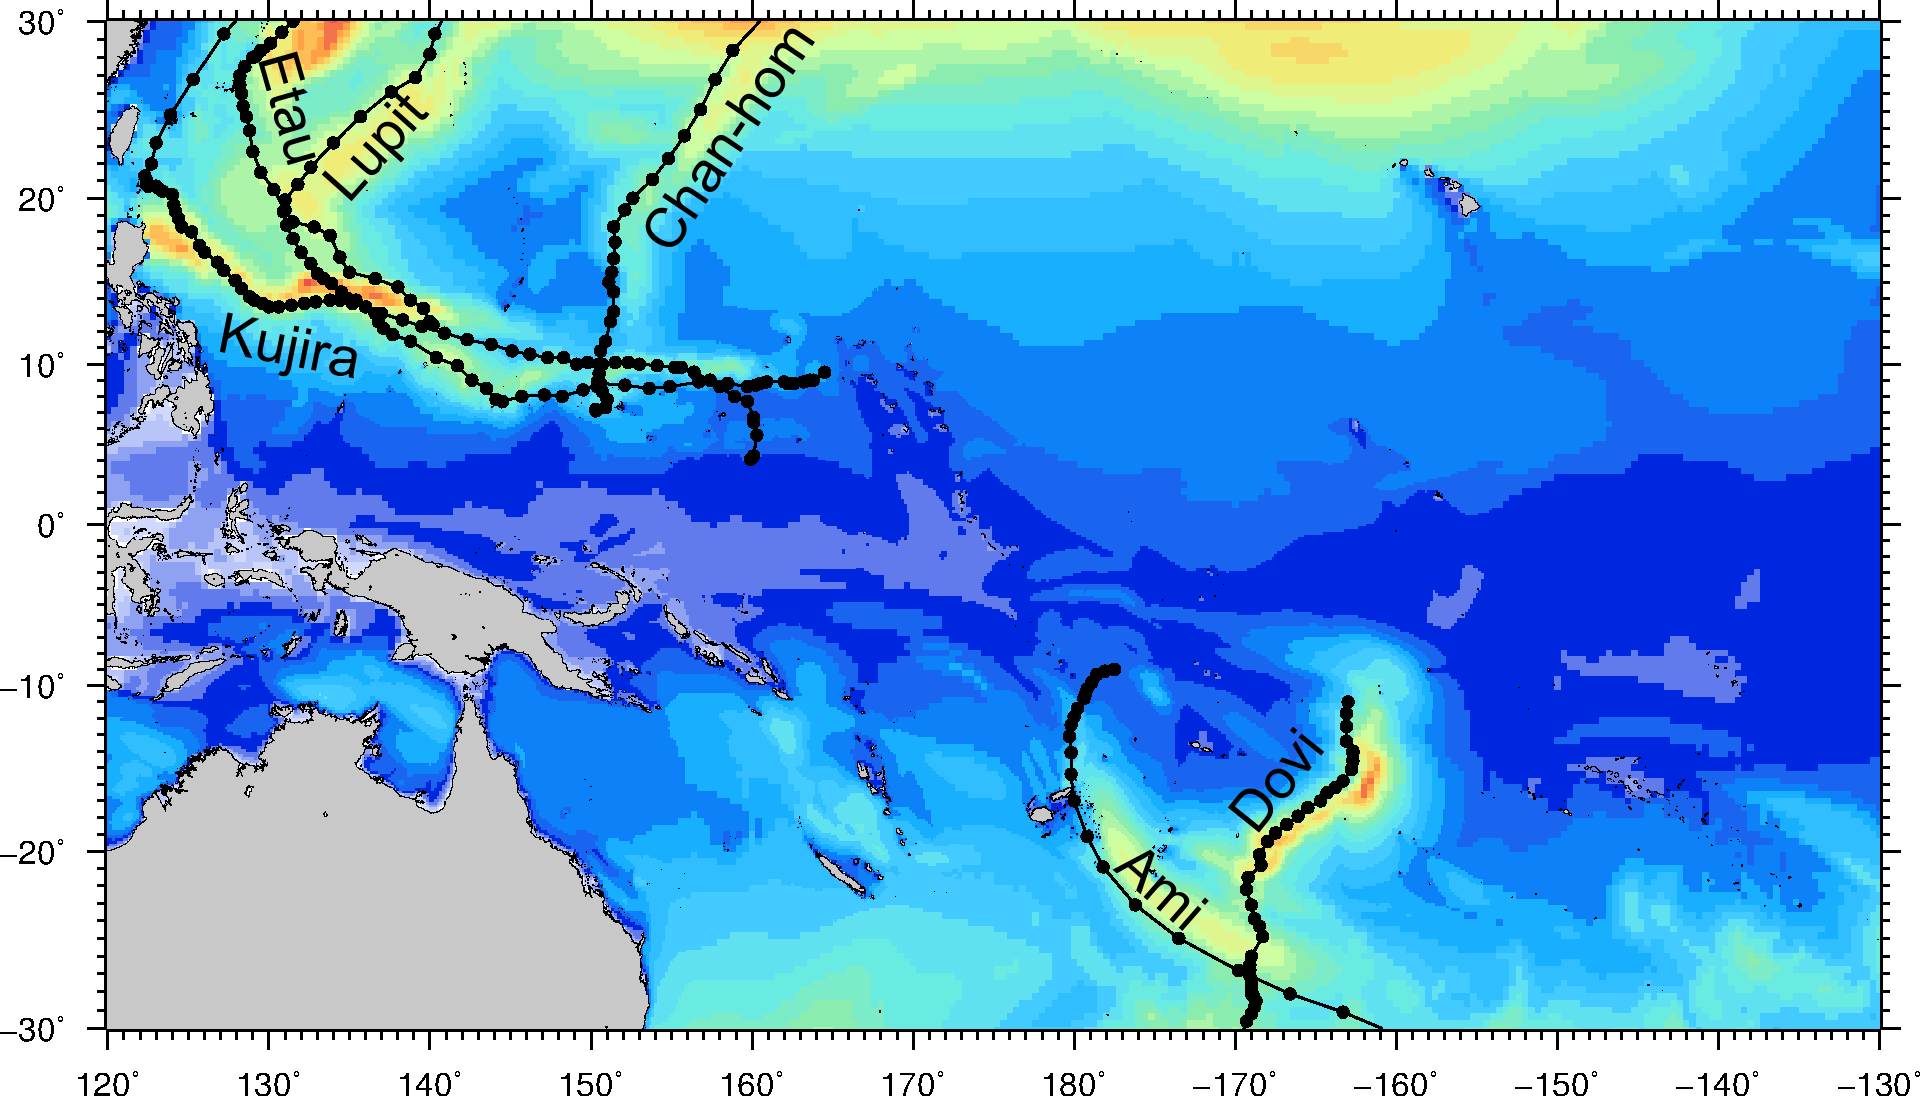
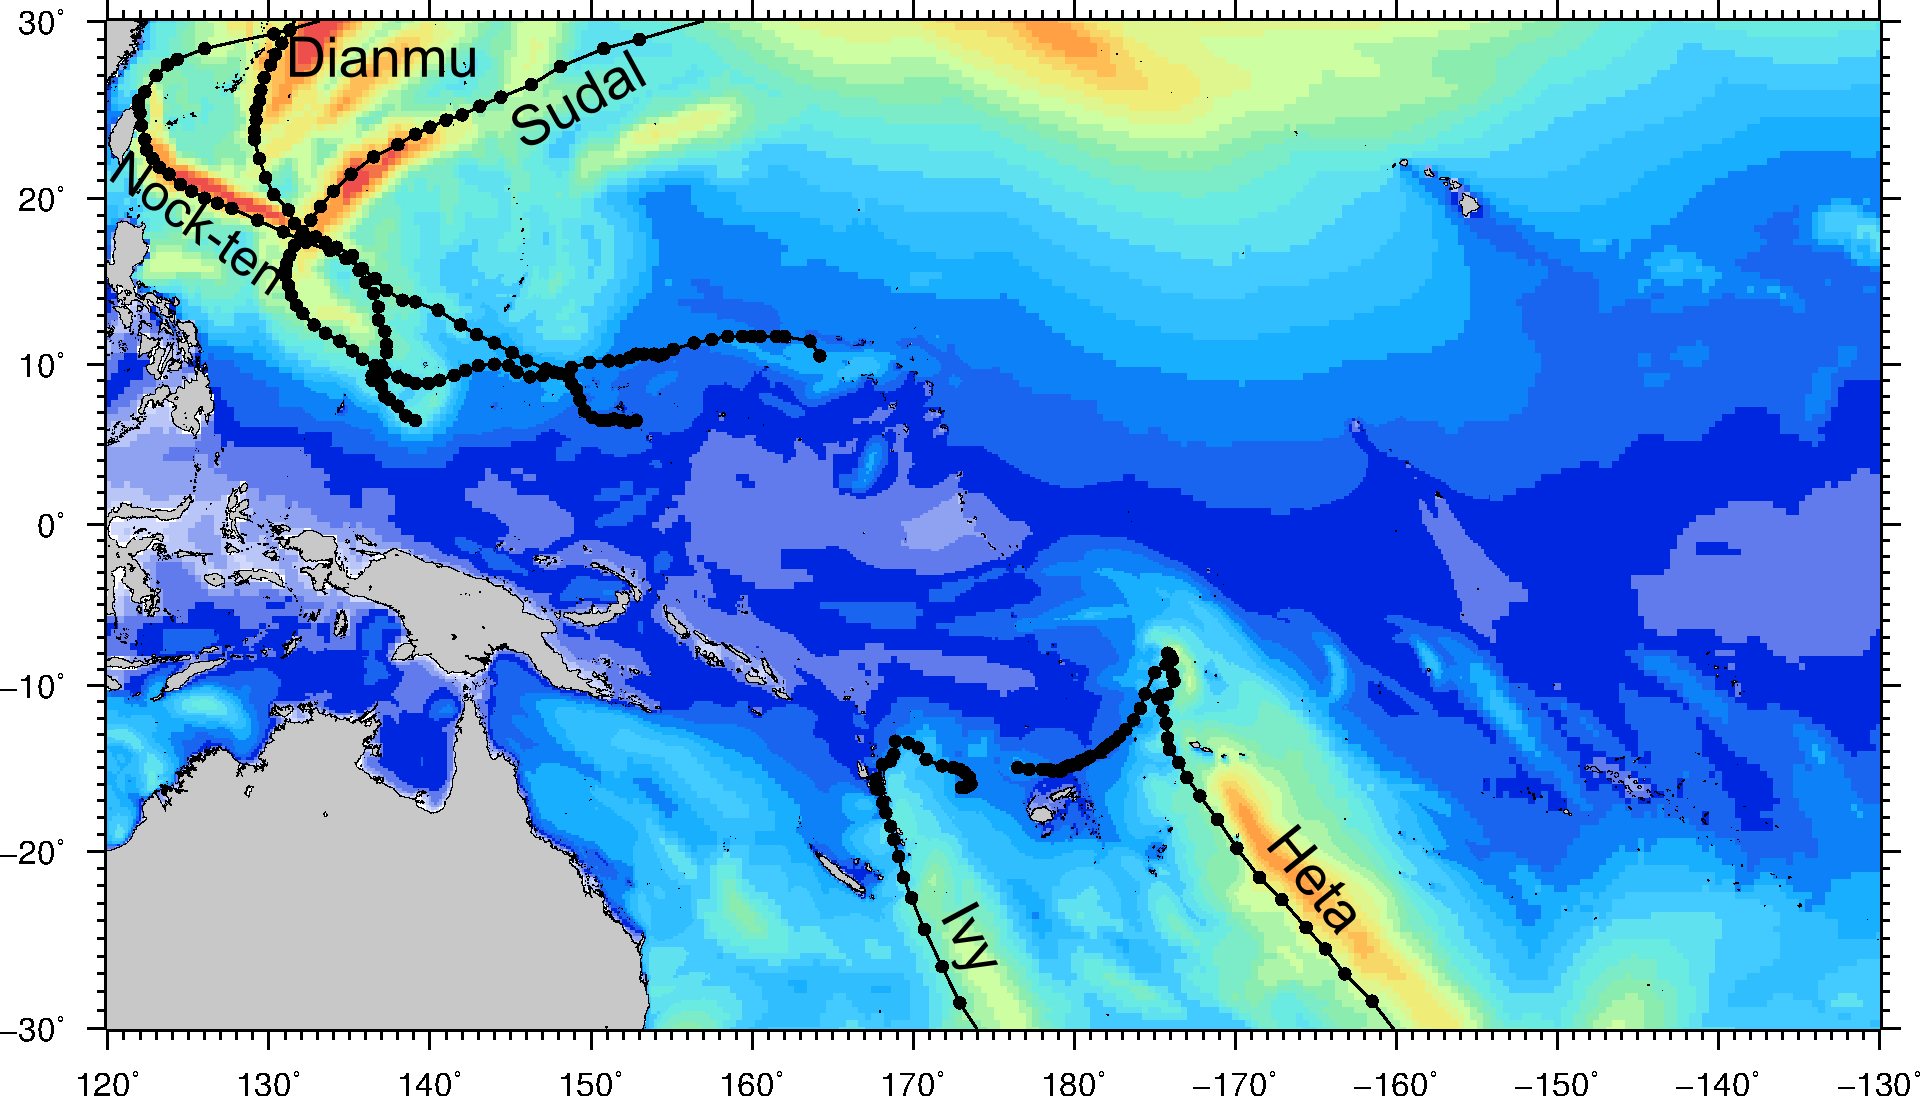
2001 - 2010
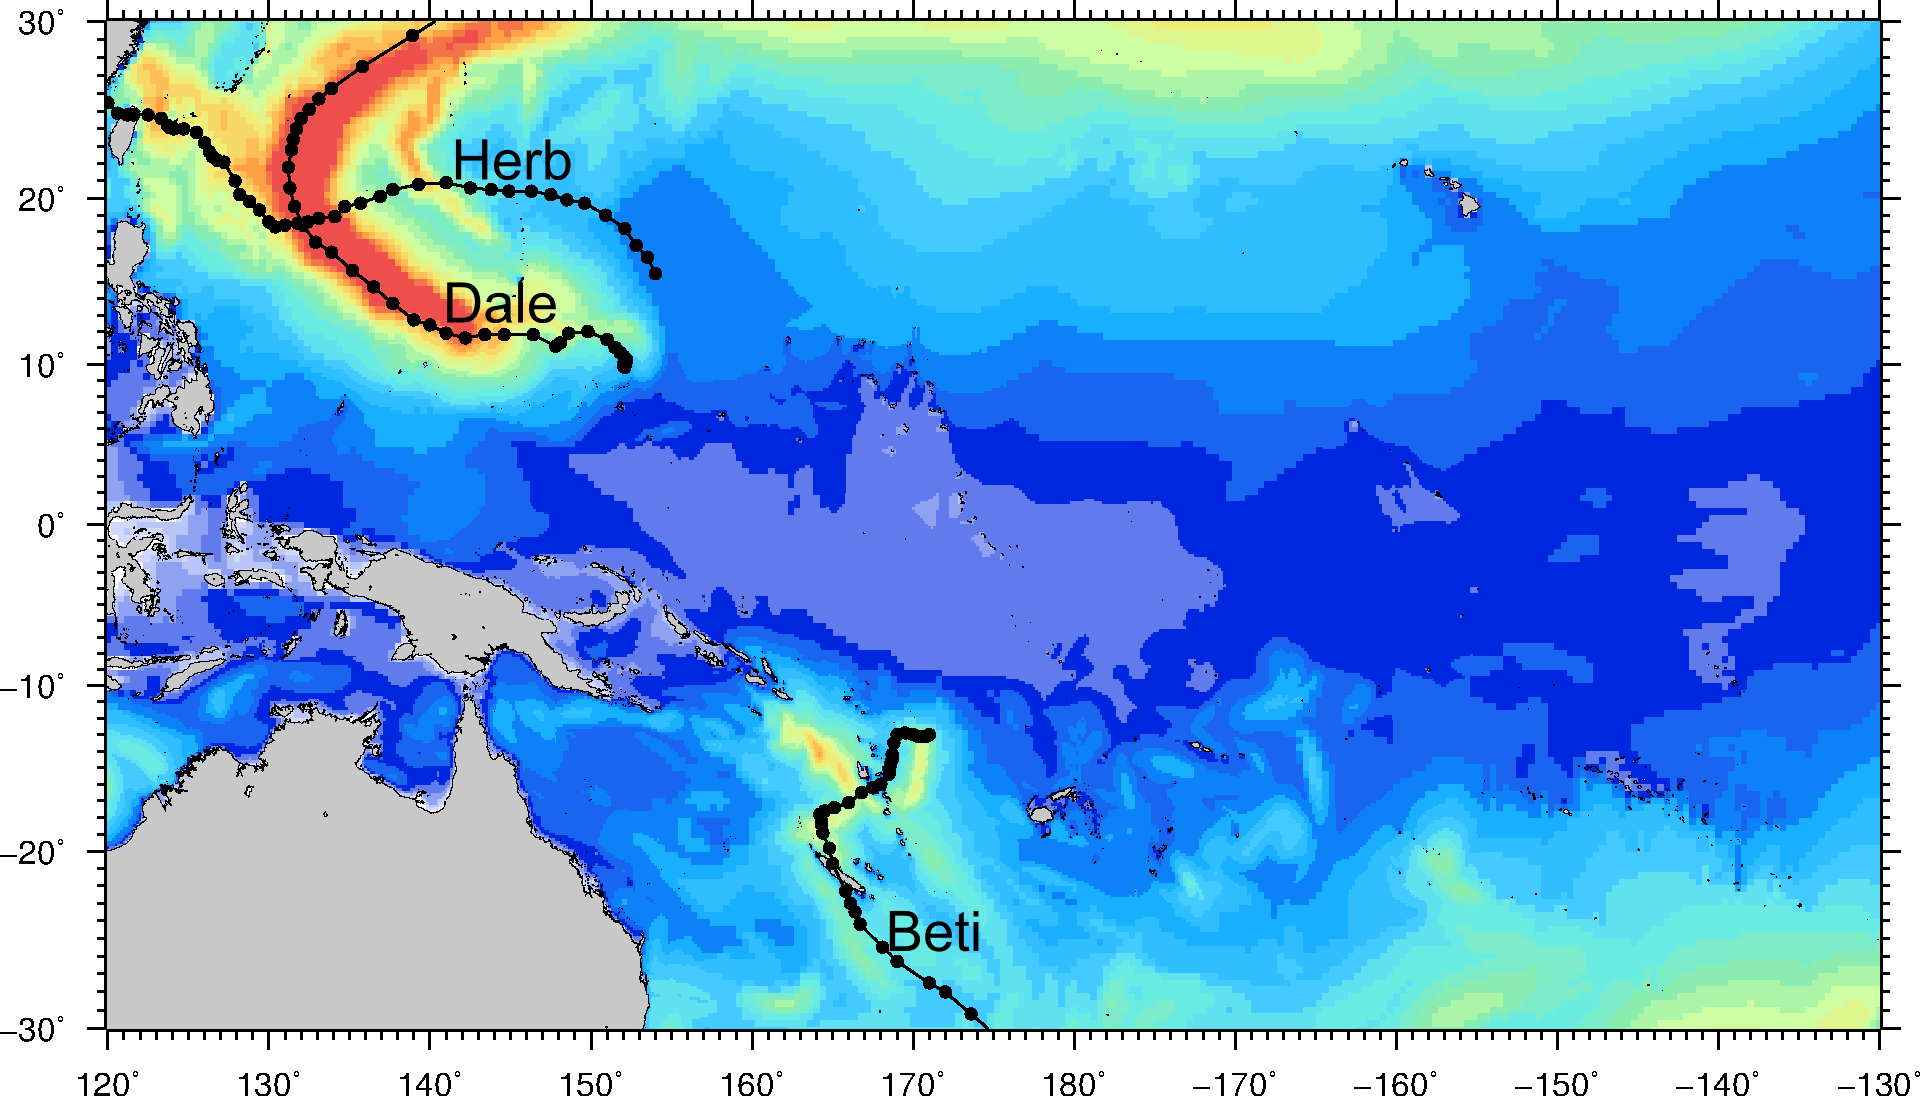
The Maps below show the maximum wave height for each year between 2001 and 2009. The most noticeable event of the decade is the swell generated from an extra tropical storm that formed South of Japan and tracked Southward. This generated huge swells which travelled to the islands that lie on the equator. These islands rarely see swell events as such and therefore this large swell caused some major inundation which damaged many crops in the low lying area. This forced the displacement of 75,000 people just in Papua New Guinea. Micronesia and the Marshall islands were also heavily hit.Read more about the 2008 swell event here.

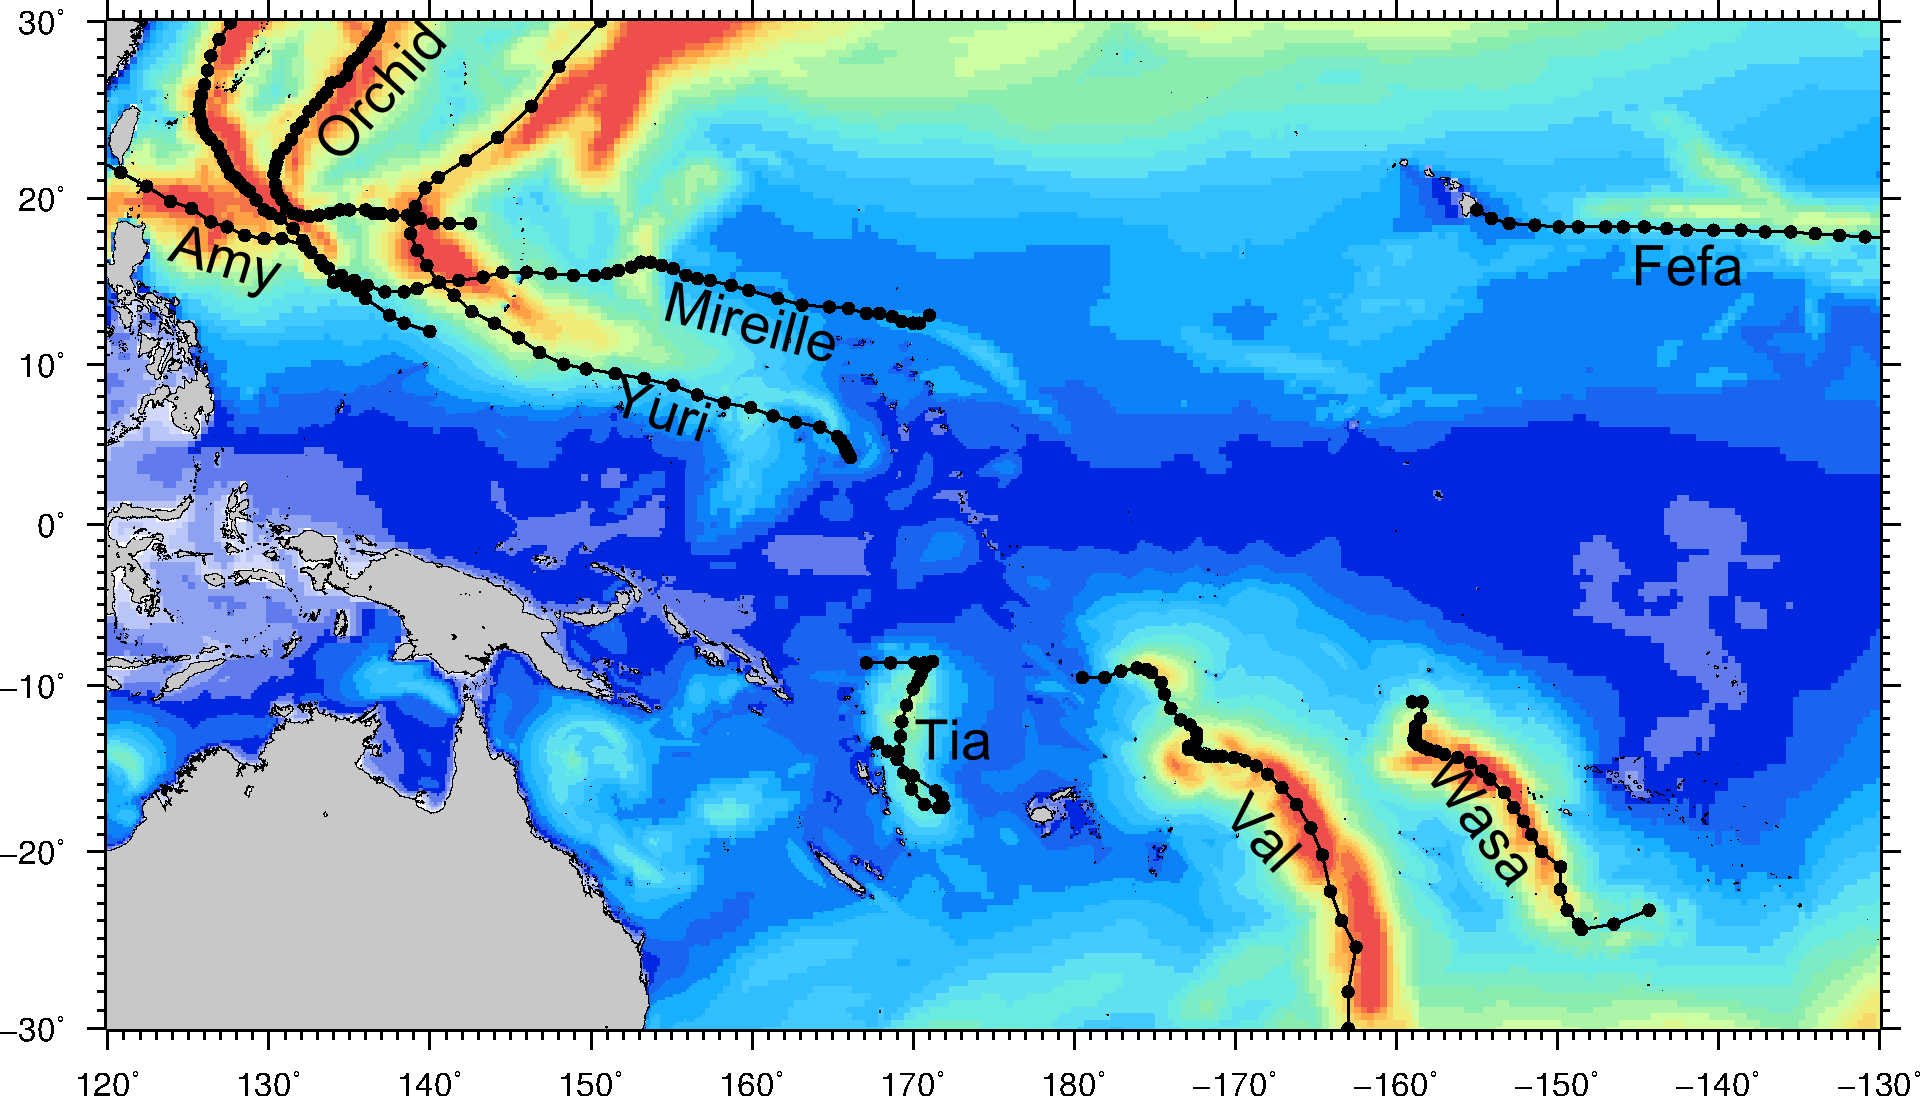
Significant wave height [m]