This page looks at the recent disaster that struck Fiji, STC Winston, and the inundation caused by it.

Background

Severe Tropical Cyclone (STC) Winston has been the strongest tropical cyclone to ever make landfall in Fiji. The system formed on 7th February and dissipated on 3rd March 2016. The highest winds recorded were 233km/h - 10 minute sustained and 285km/h - 1 minute sustained, while the lowest recorded pressure was 929 hPa.

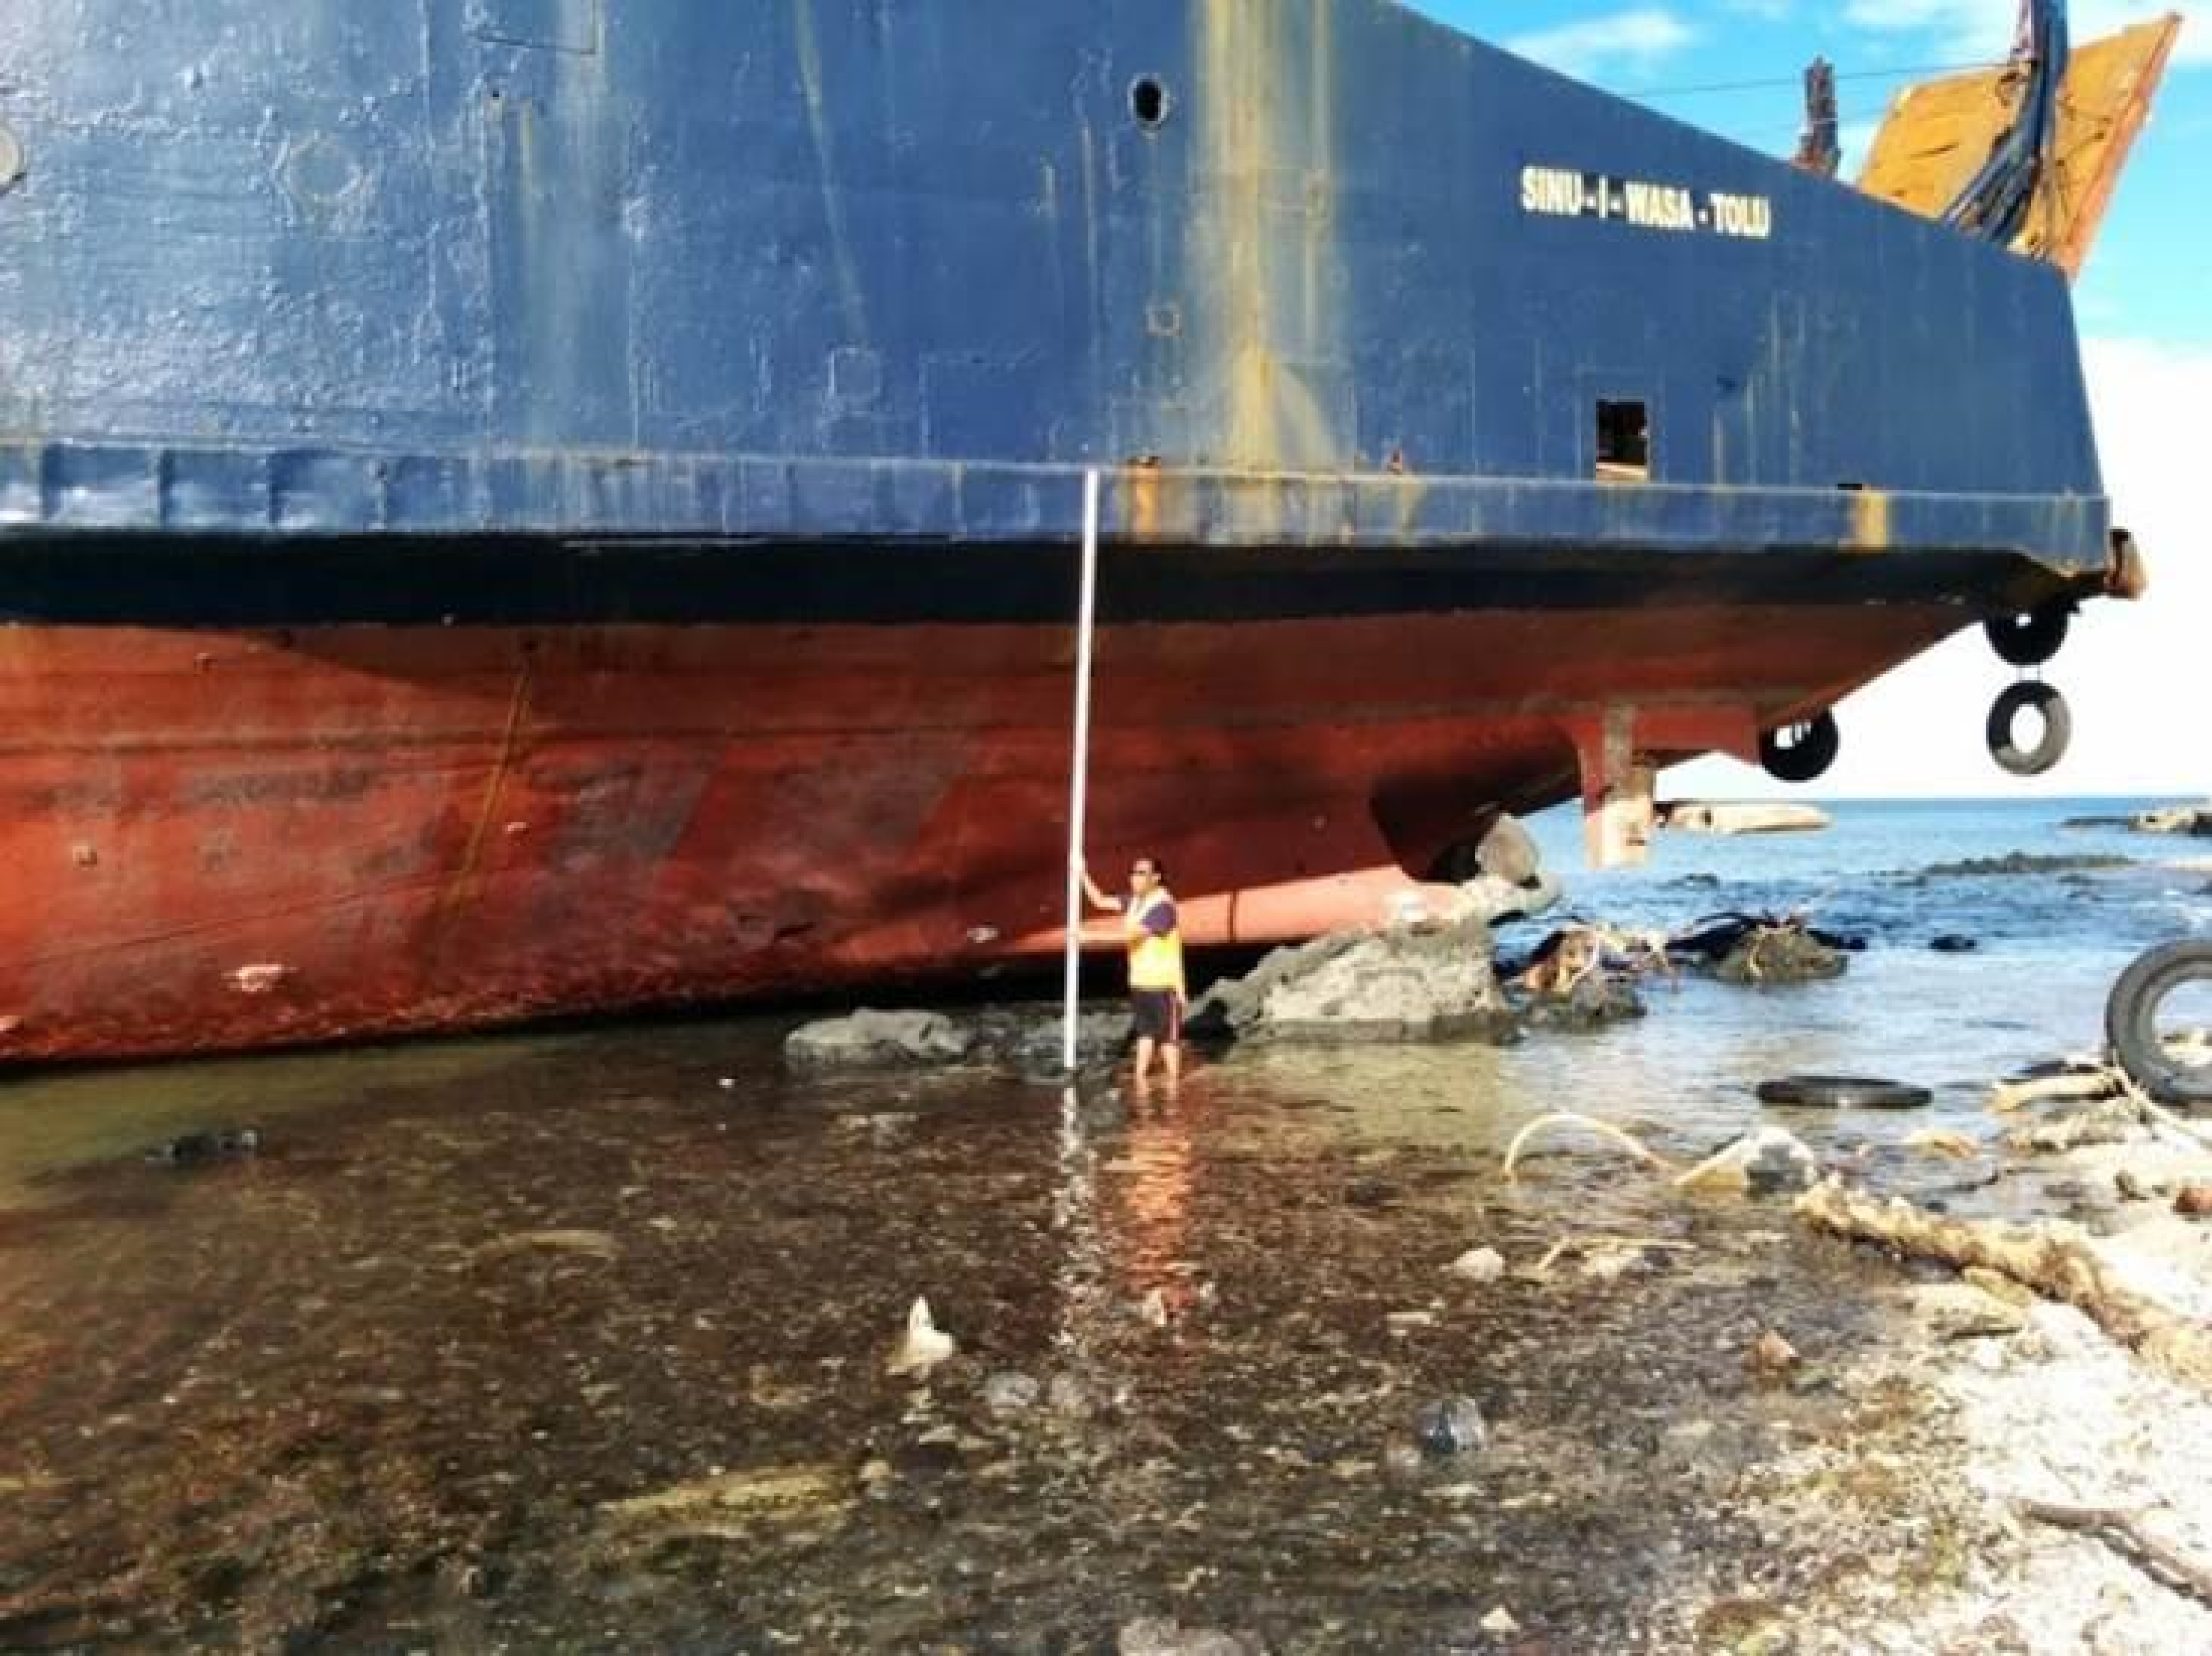
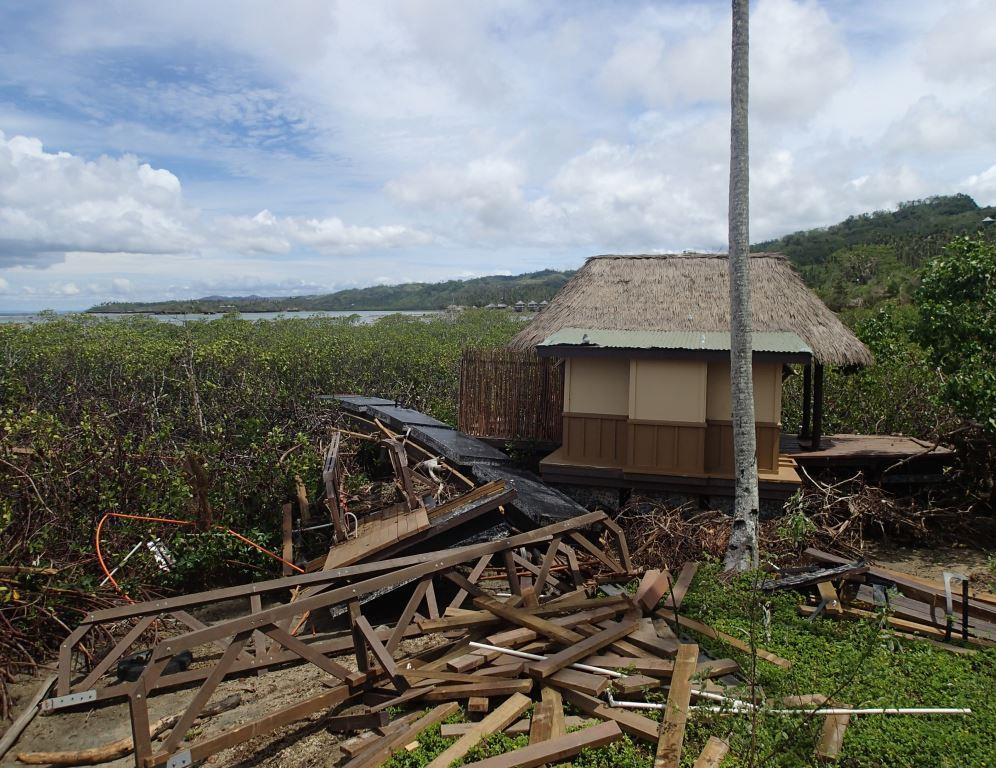
The cyclone had a vast impact on the population, infrastructure and the economy. There were a total of 44 casualities, 50,000 people in evacuation centres, and a total of 350,000 people affected in one way or the other. Approximately 30,000 homes were destroyed, 7 ferries were wrecked or stranded and 240 schools were either severely damaged or destroyed. All of these accounted for a FJ$2.0 billion loss and around FJ$0.5 billion damage. 80% of the loss recorded was from Agriculture. Also 80% of the nation was without power right after the event.


Post-Disaster Inundation and Building Damage Assessment

Introduction

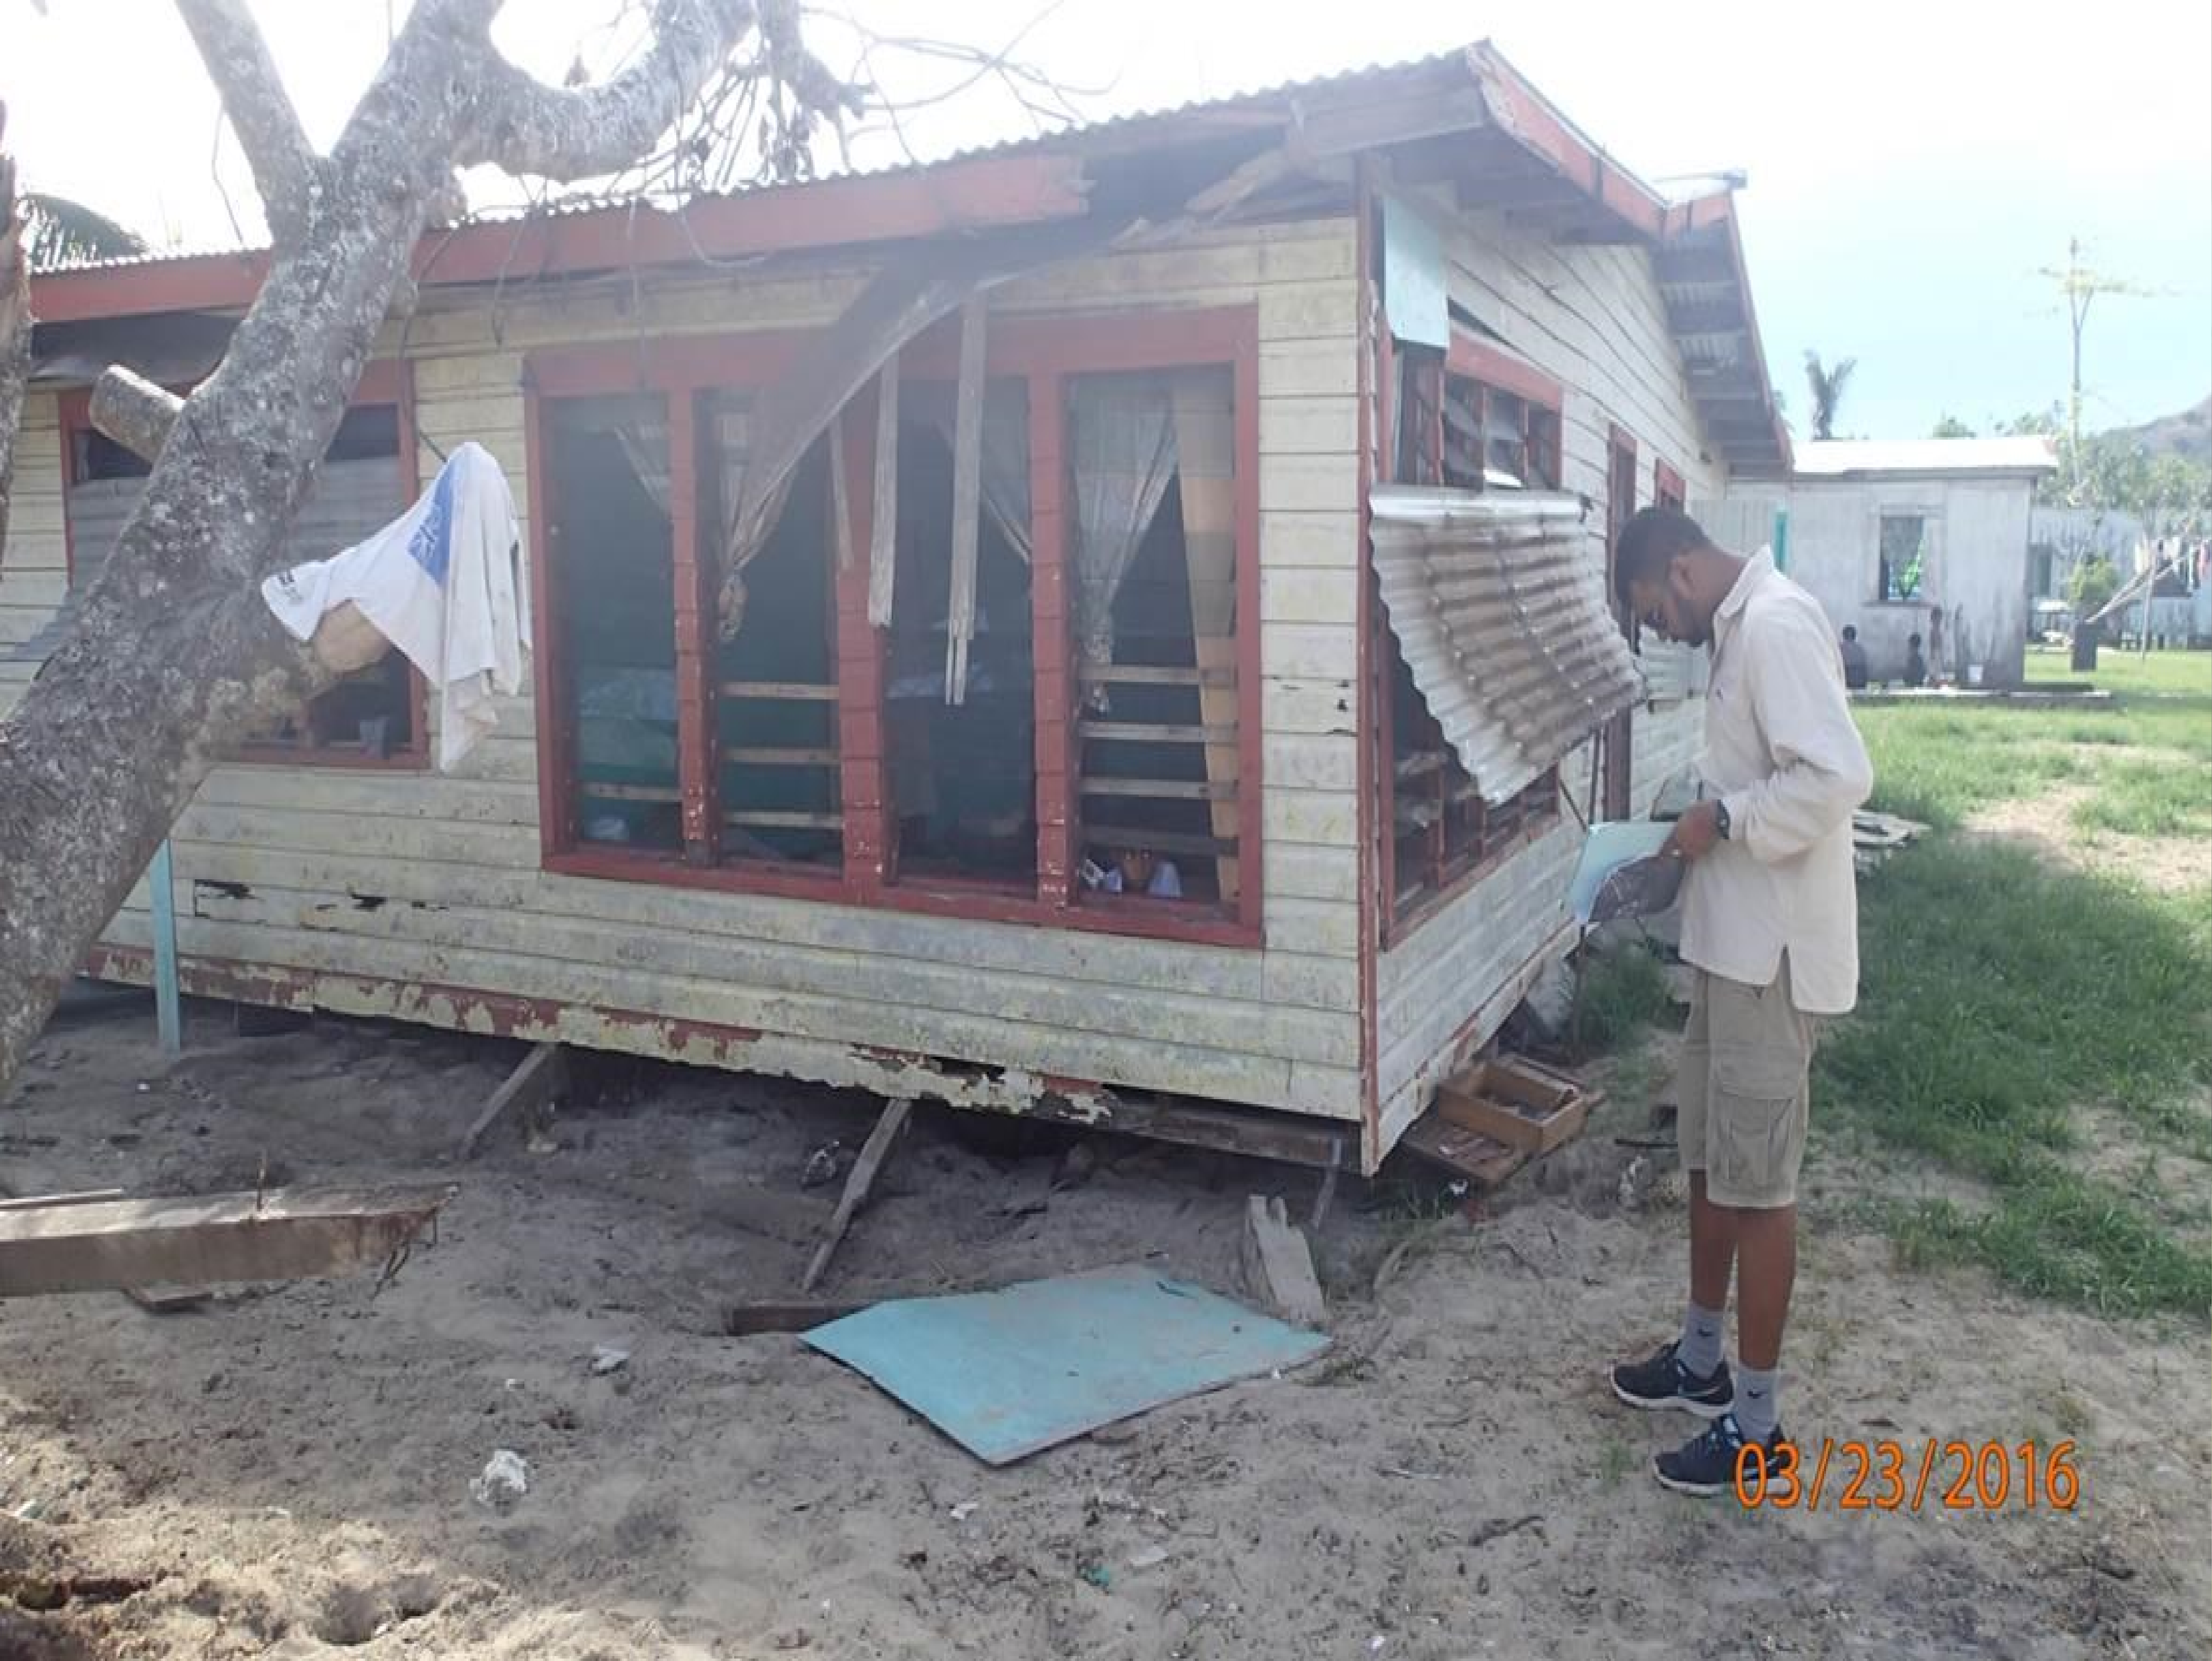
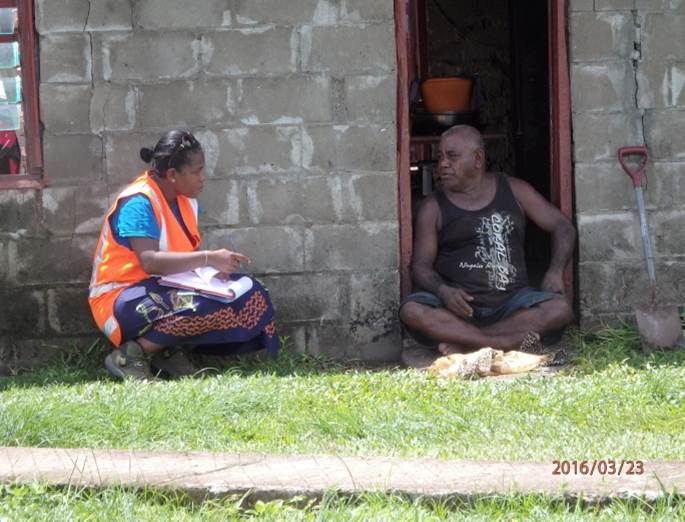
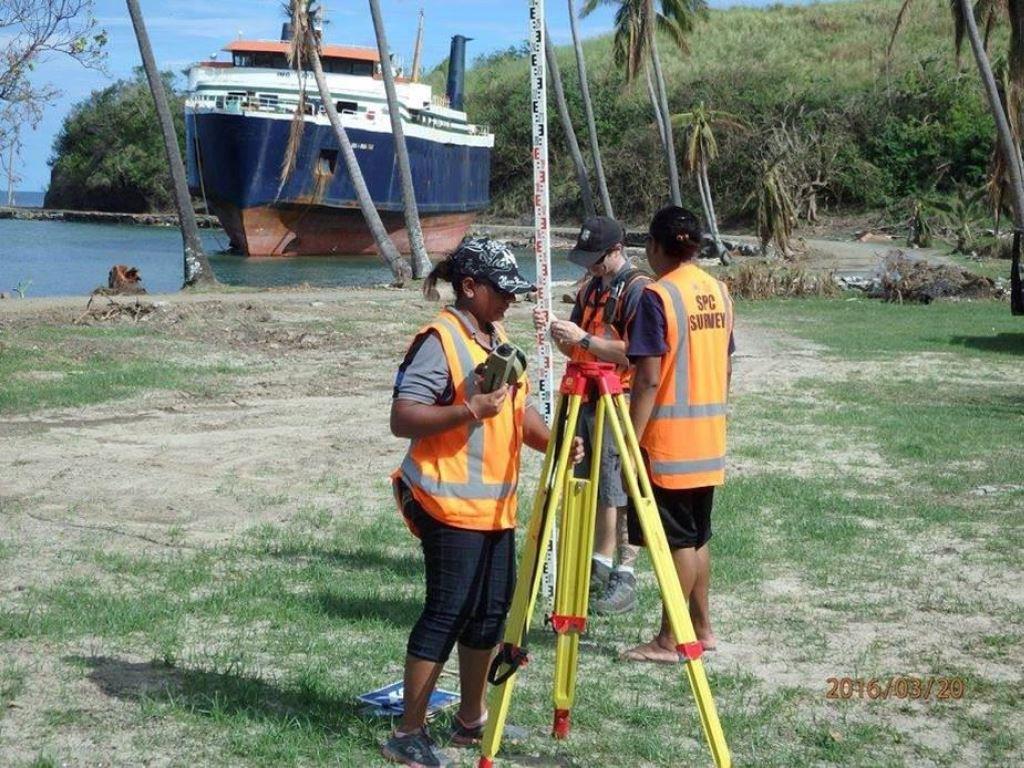
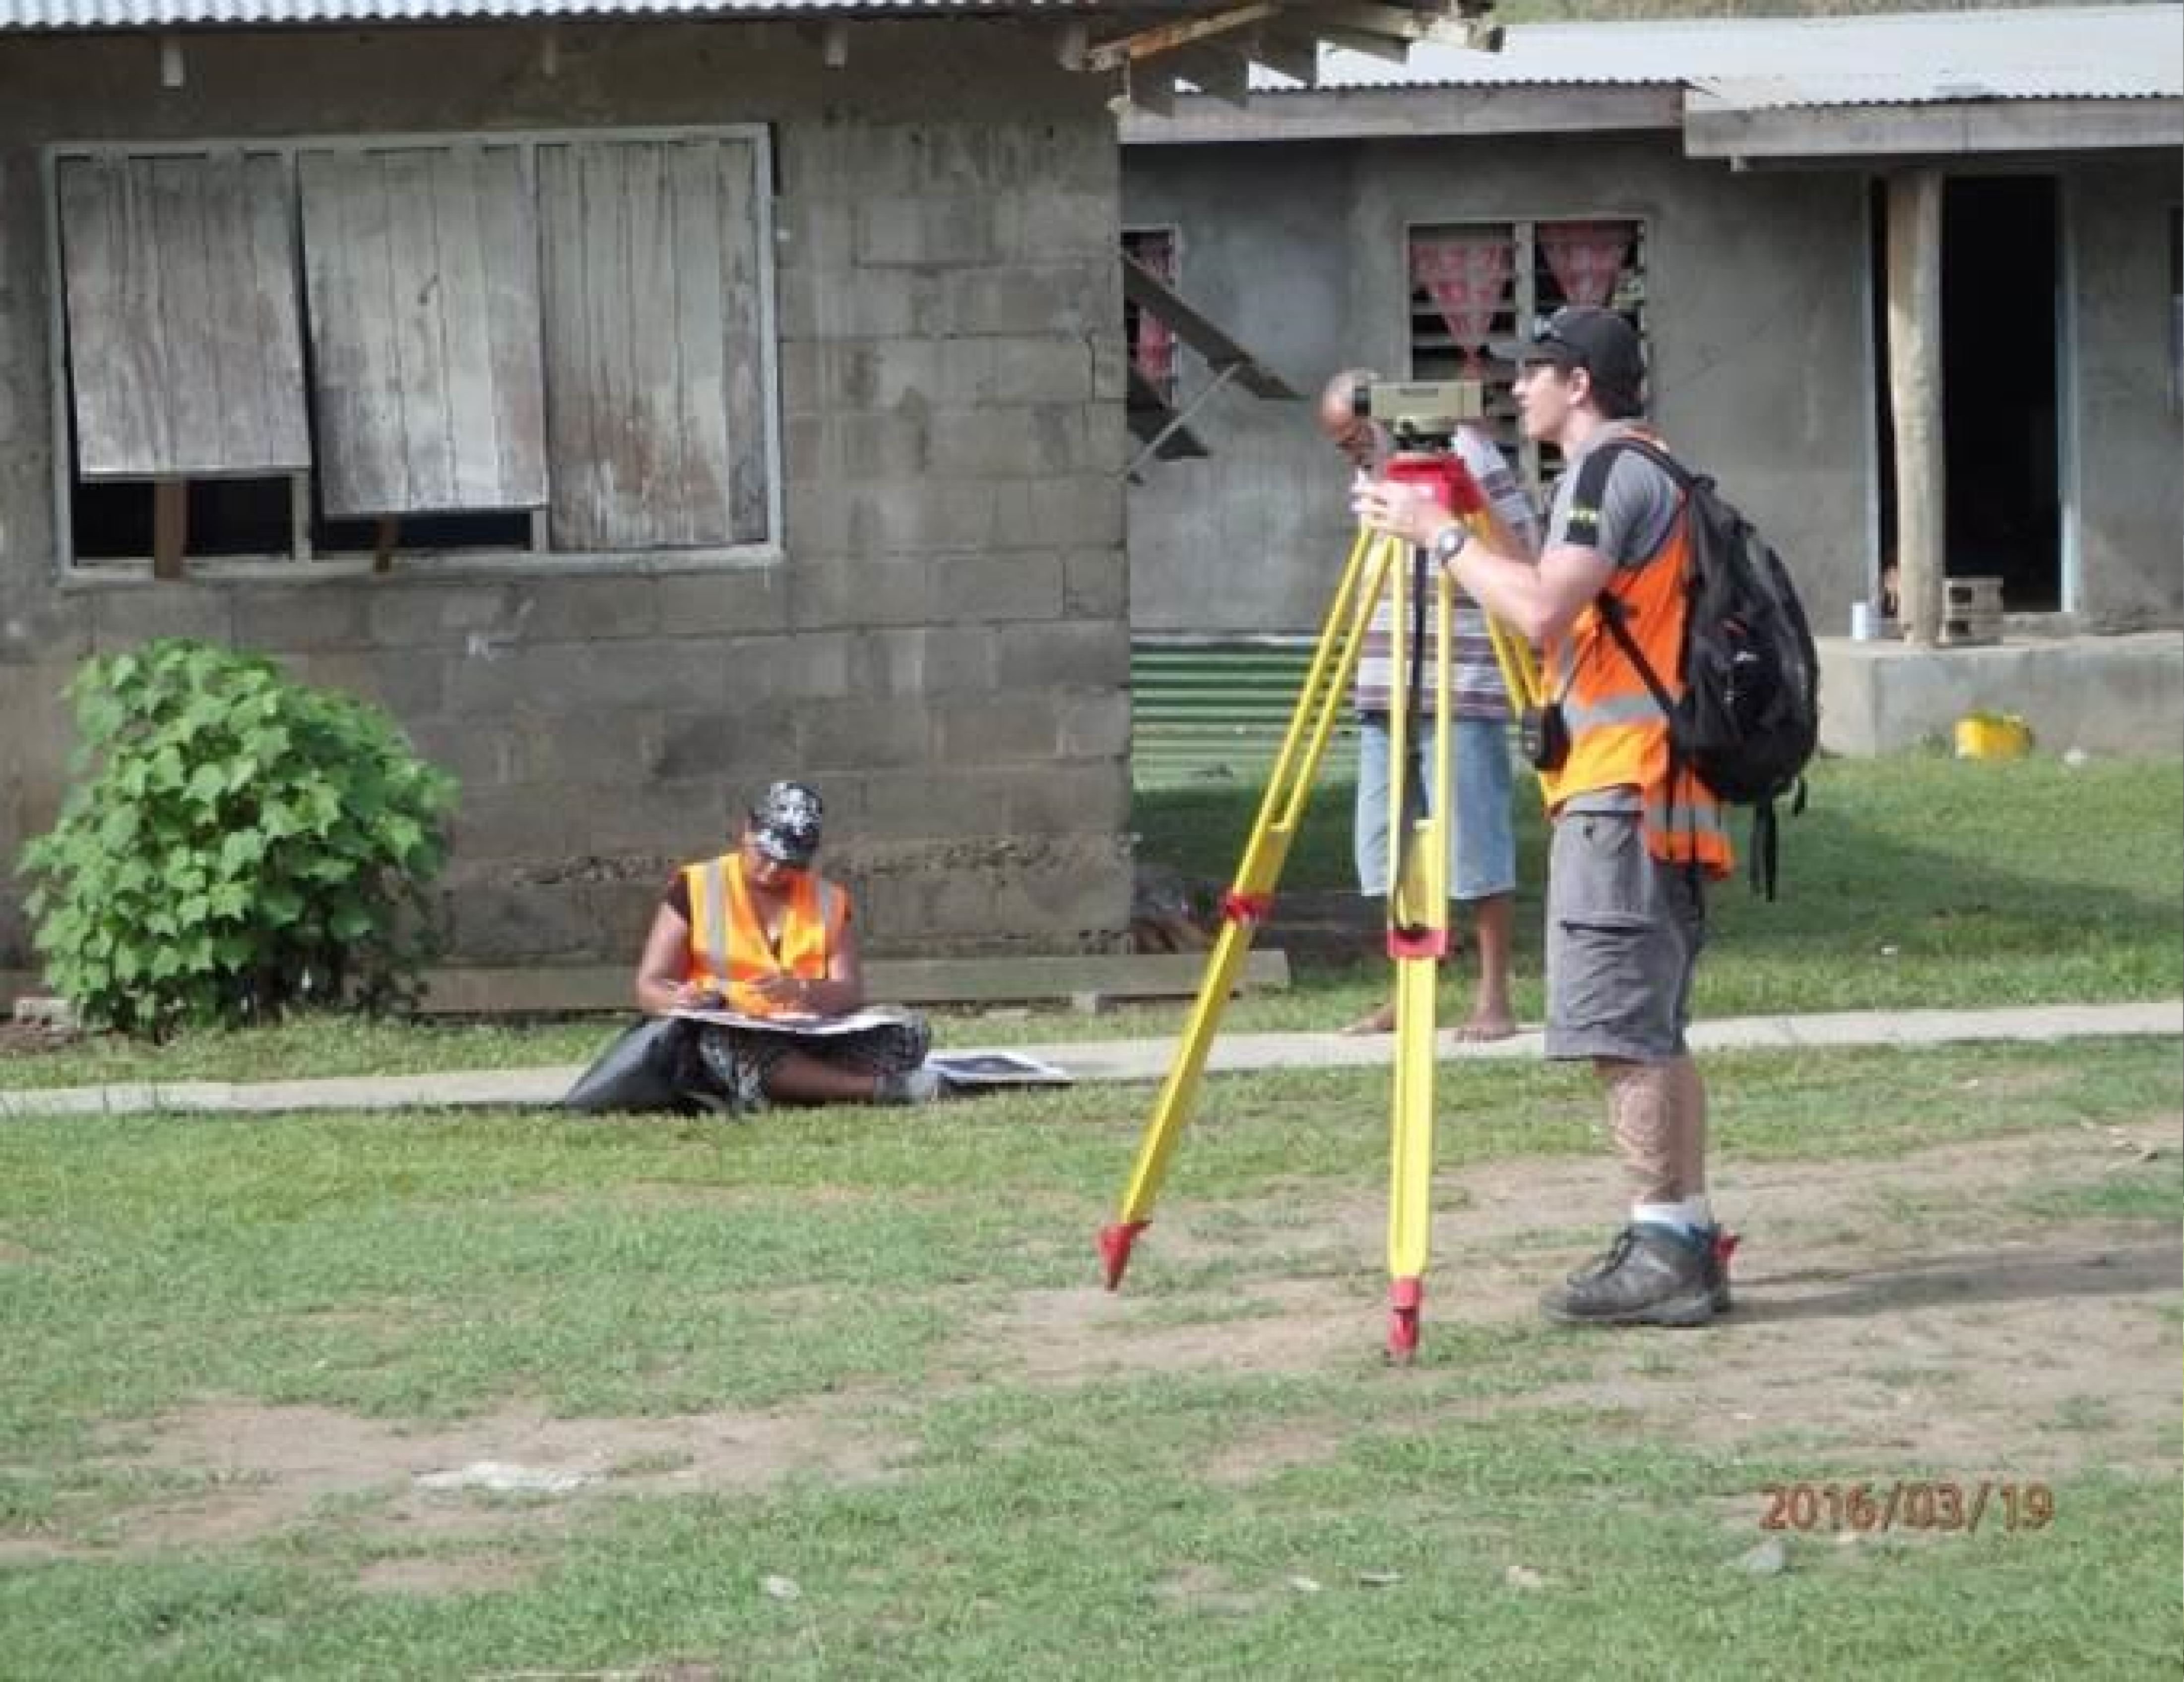
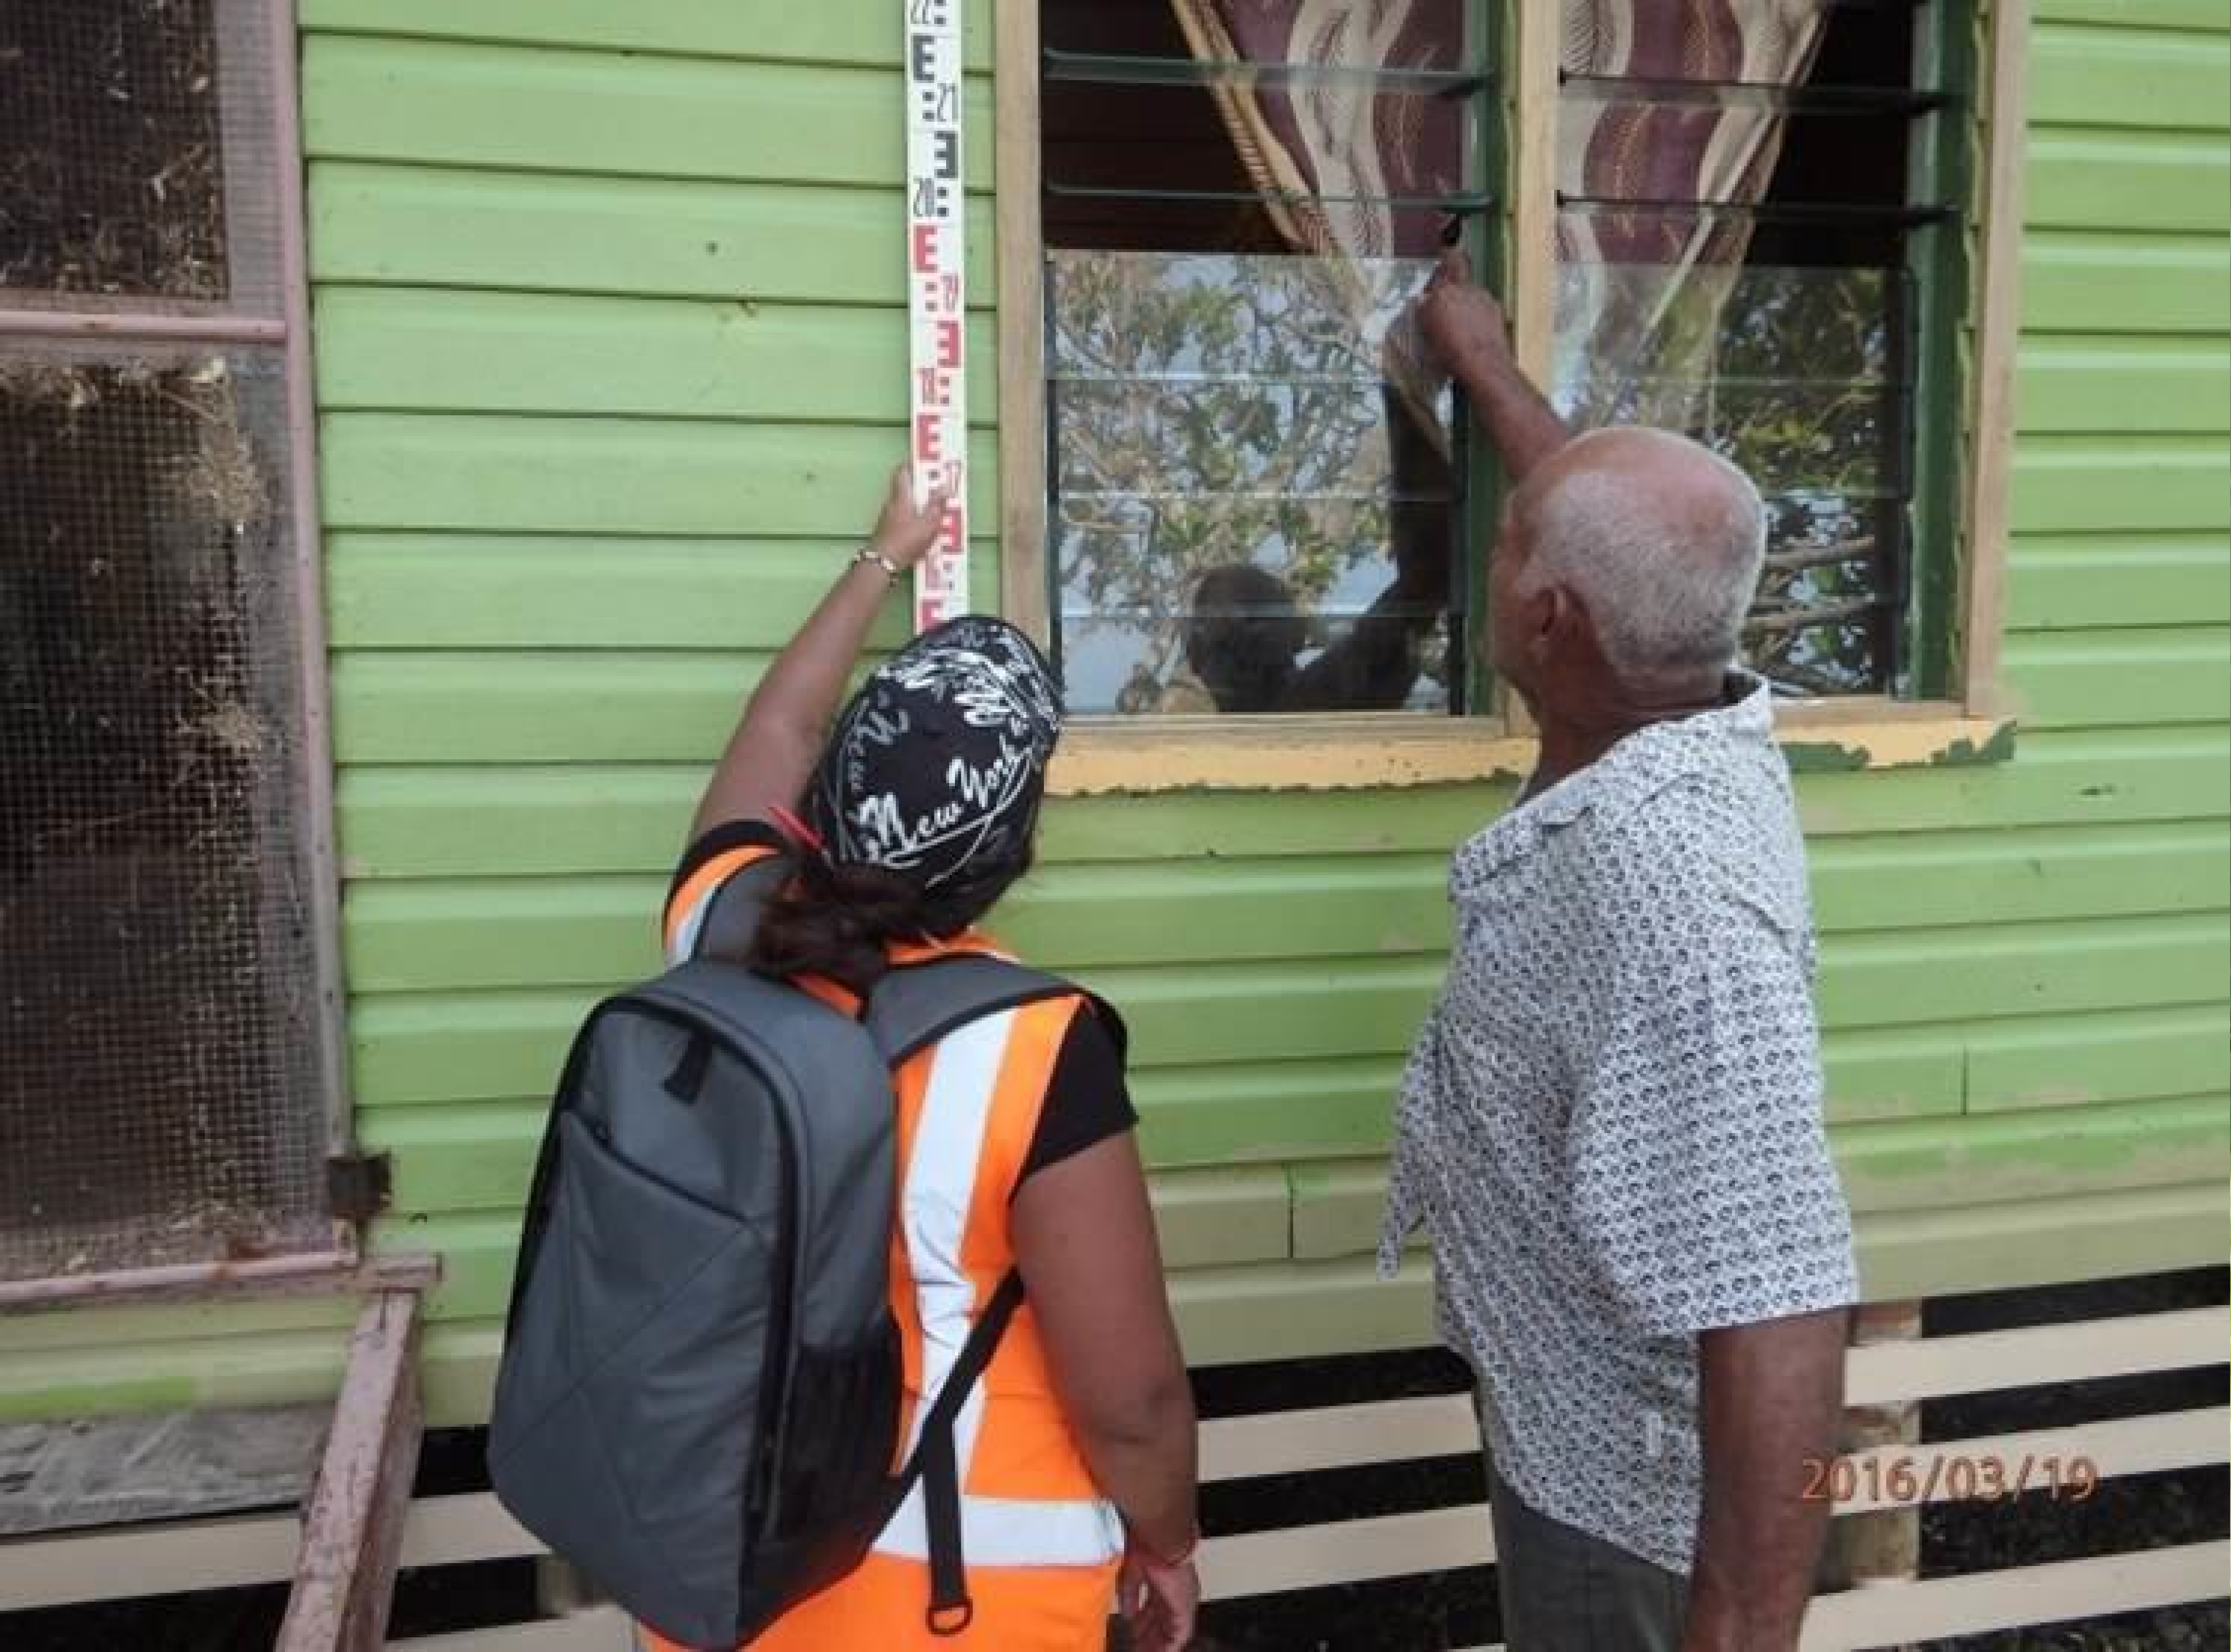
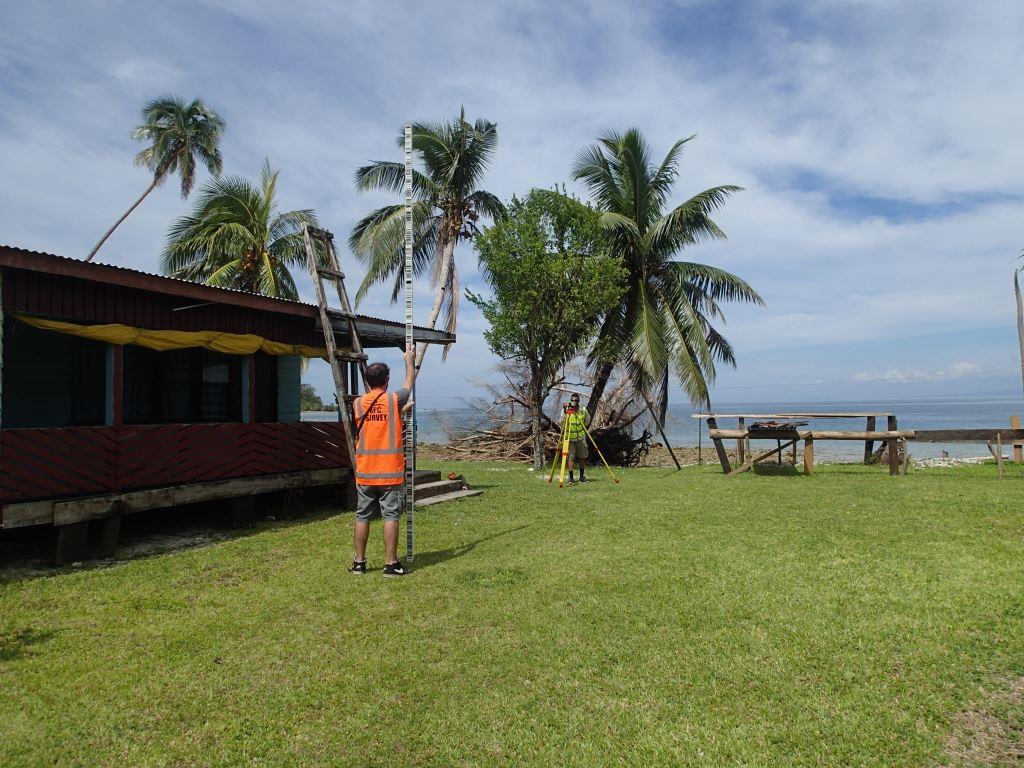
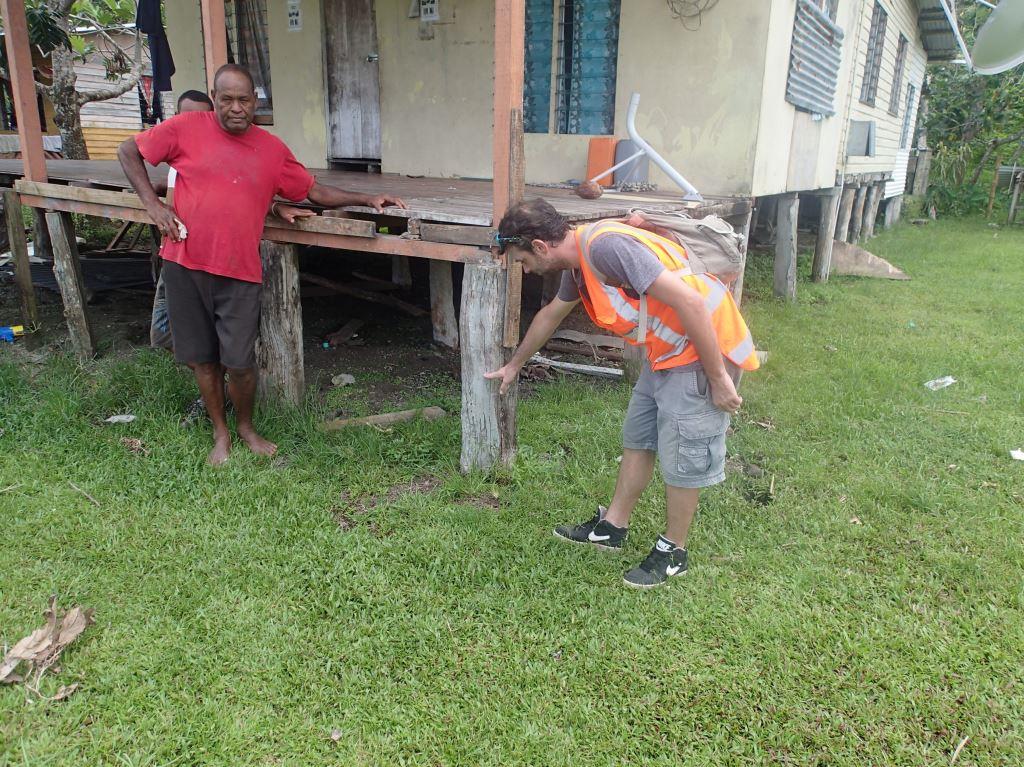
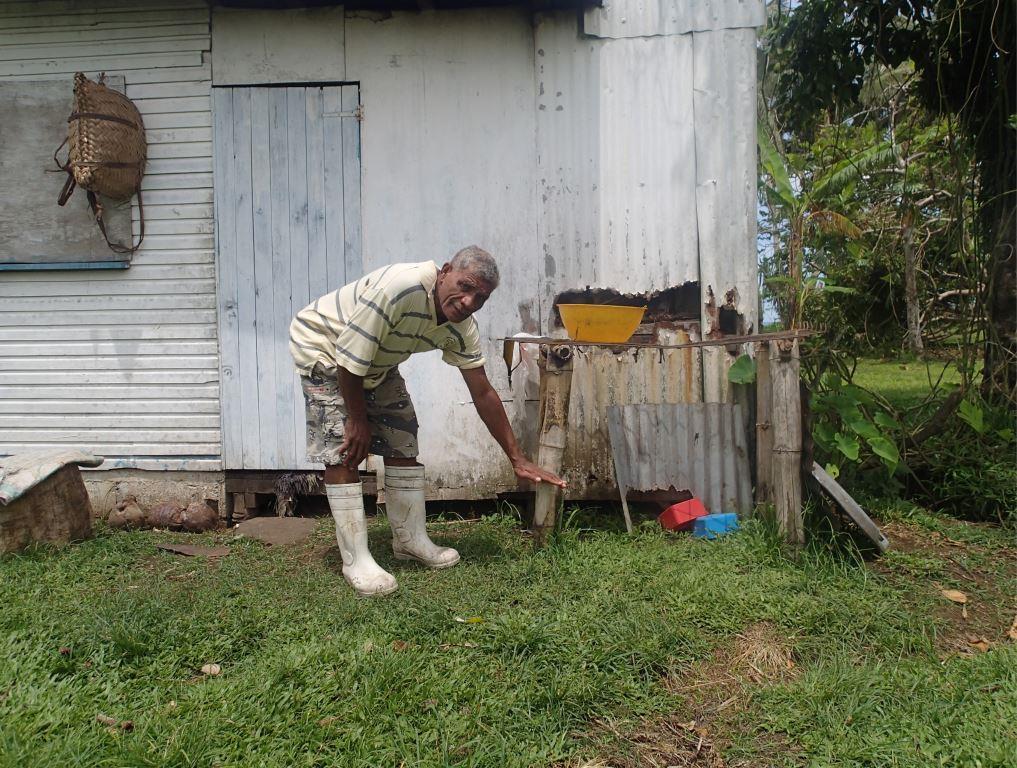
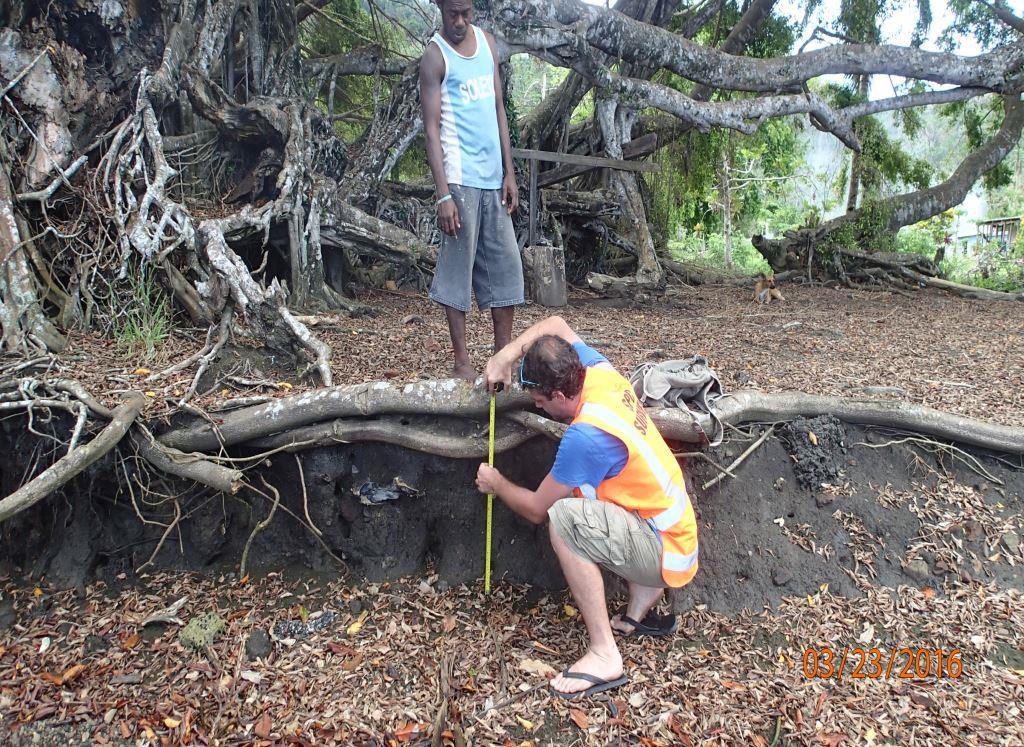
SPC had carried out a post - inundation survey for STC Winston a month after the event had hit Fiji. Two locations were selected for this assessment on the basis of it being most affected and the areas where the assessment had not being conducted so far. They were Ovalau and the Southern part of Vanua Levu. The survey was for 1 week with 2 teams of 4 staffs. 21 villages/settlements were assessed in Ovalau while in Vanua Levu 26 villages/settlements were assessed. Data on run-up, flow depth, inundation extent and building damages were collected.

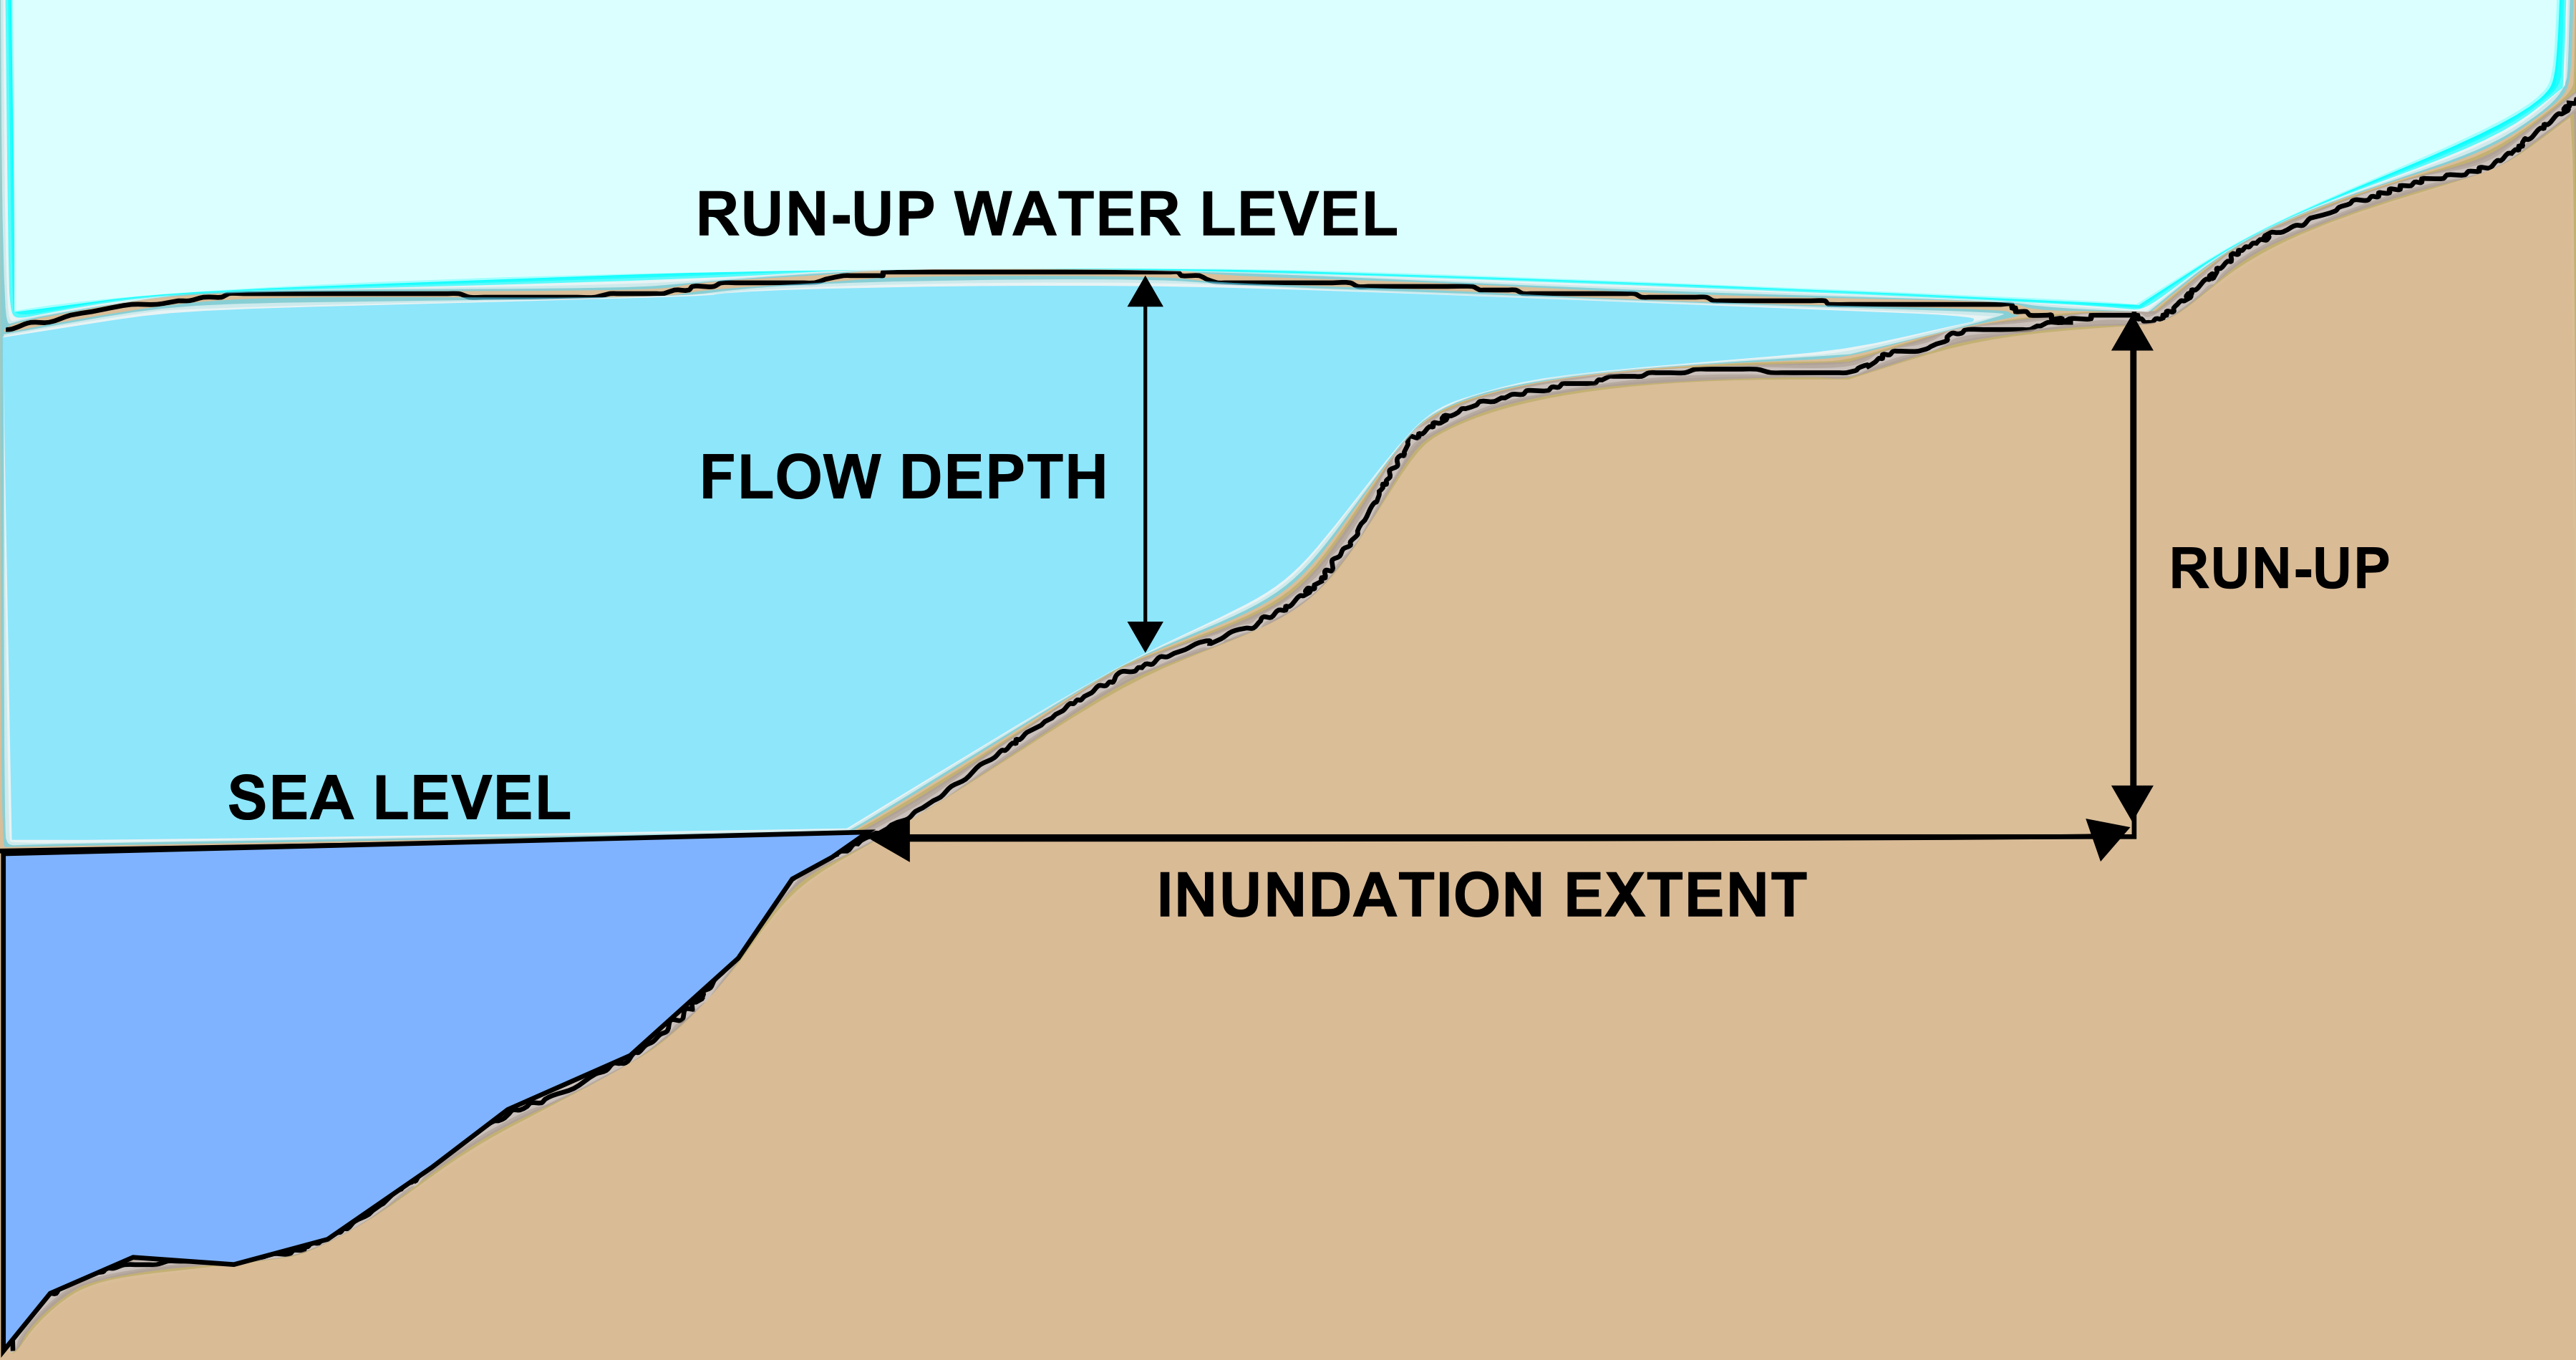
The diagram below illustrates the parameters that were measured. Inundation extent referes to the distance that the waves travel inland. Run - up is the elevation above sea level that the wave reaches. Flow depth is the highest water mark measured which is different from run-up as it is observed at the inundation line on the side of a structure or tree.


Diagram of the parameters measured
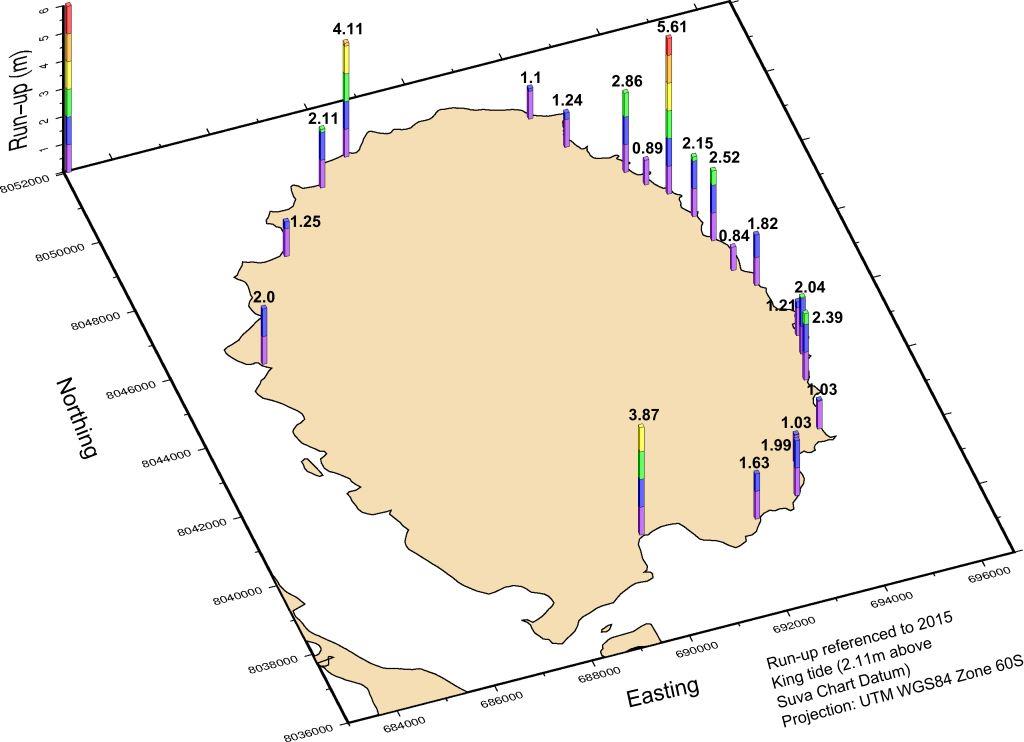
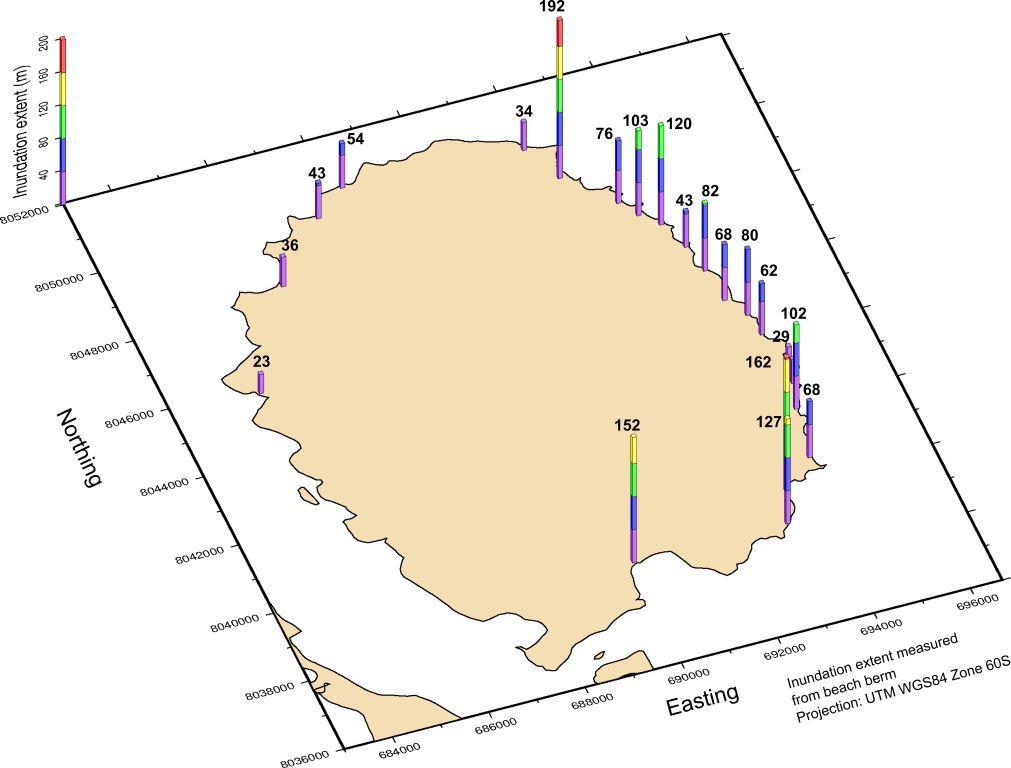
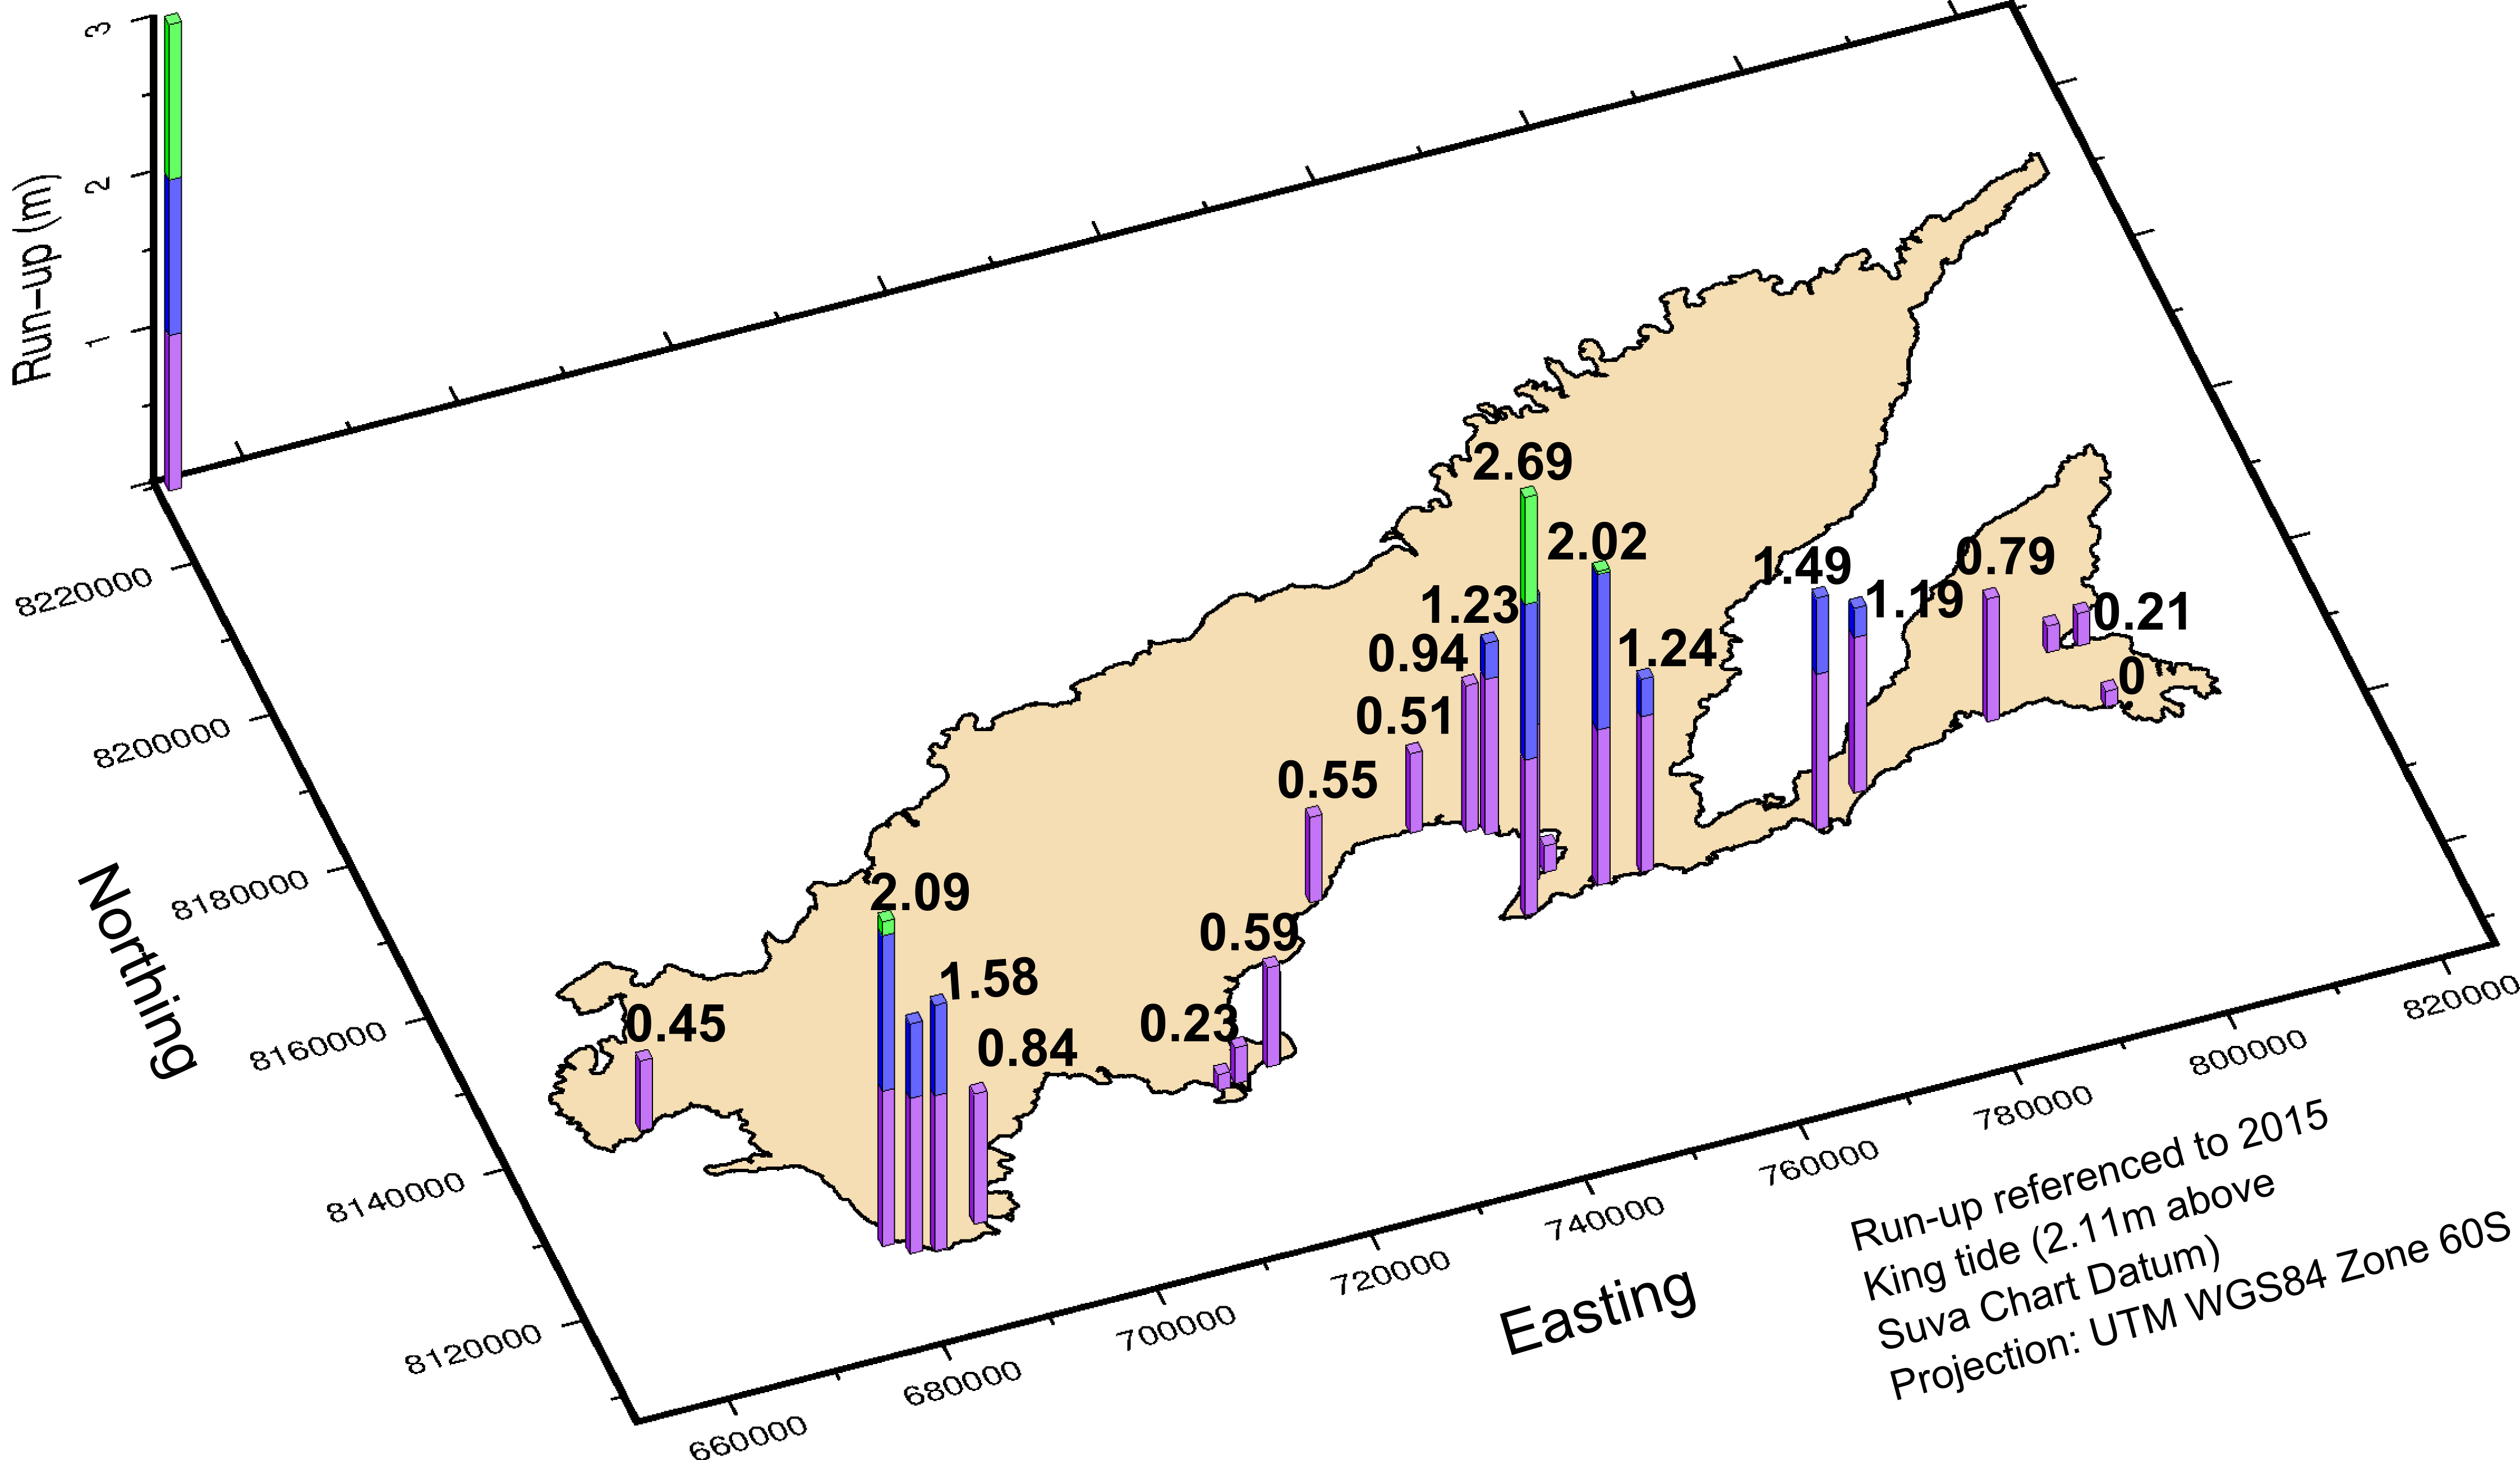
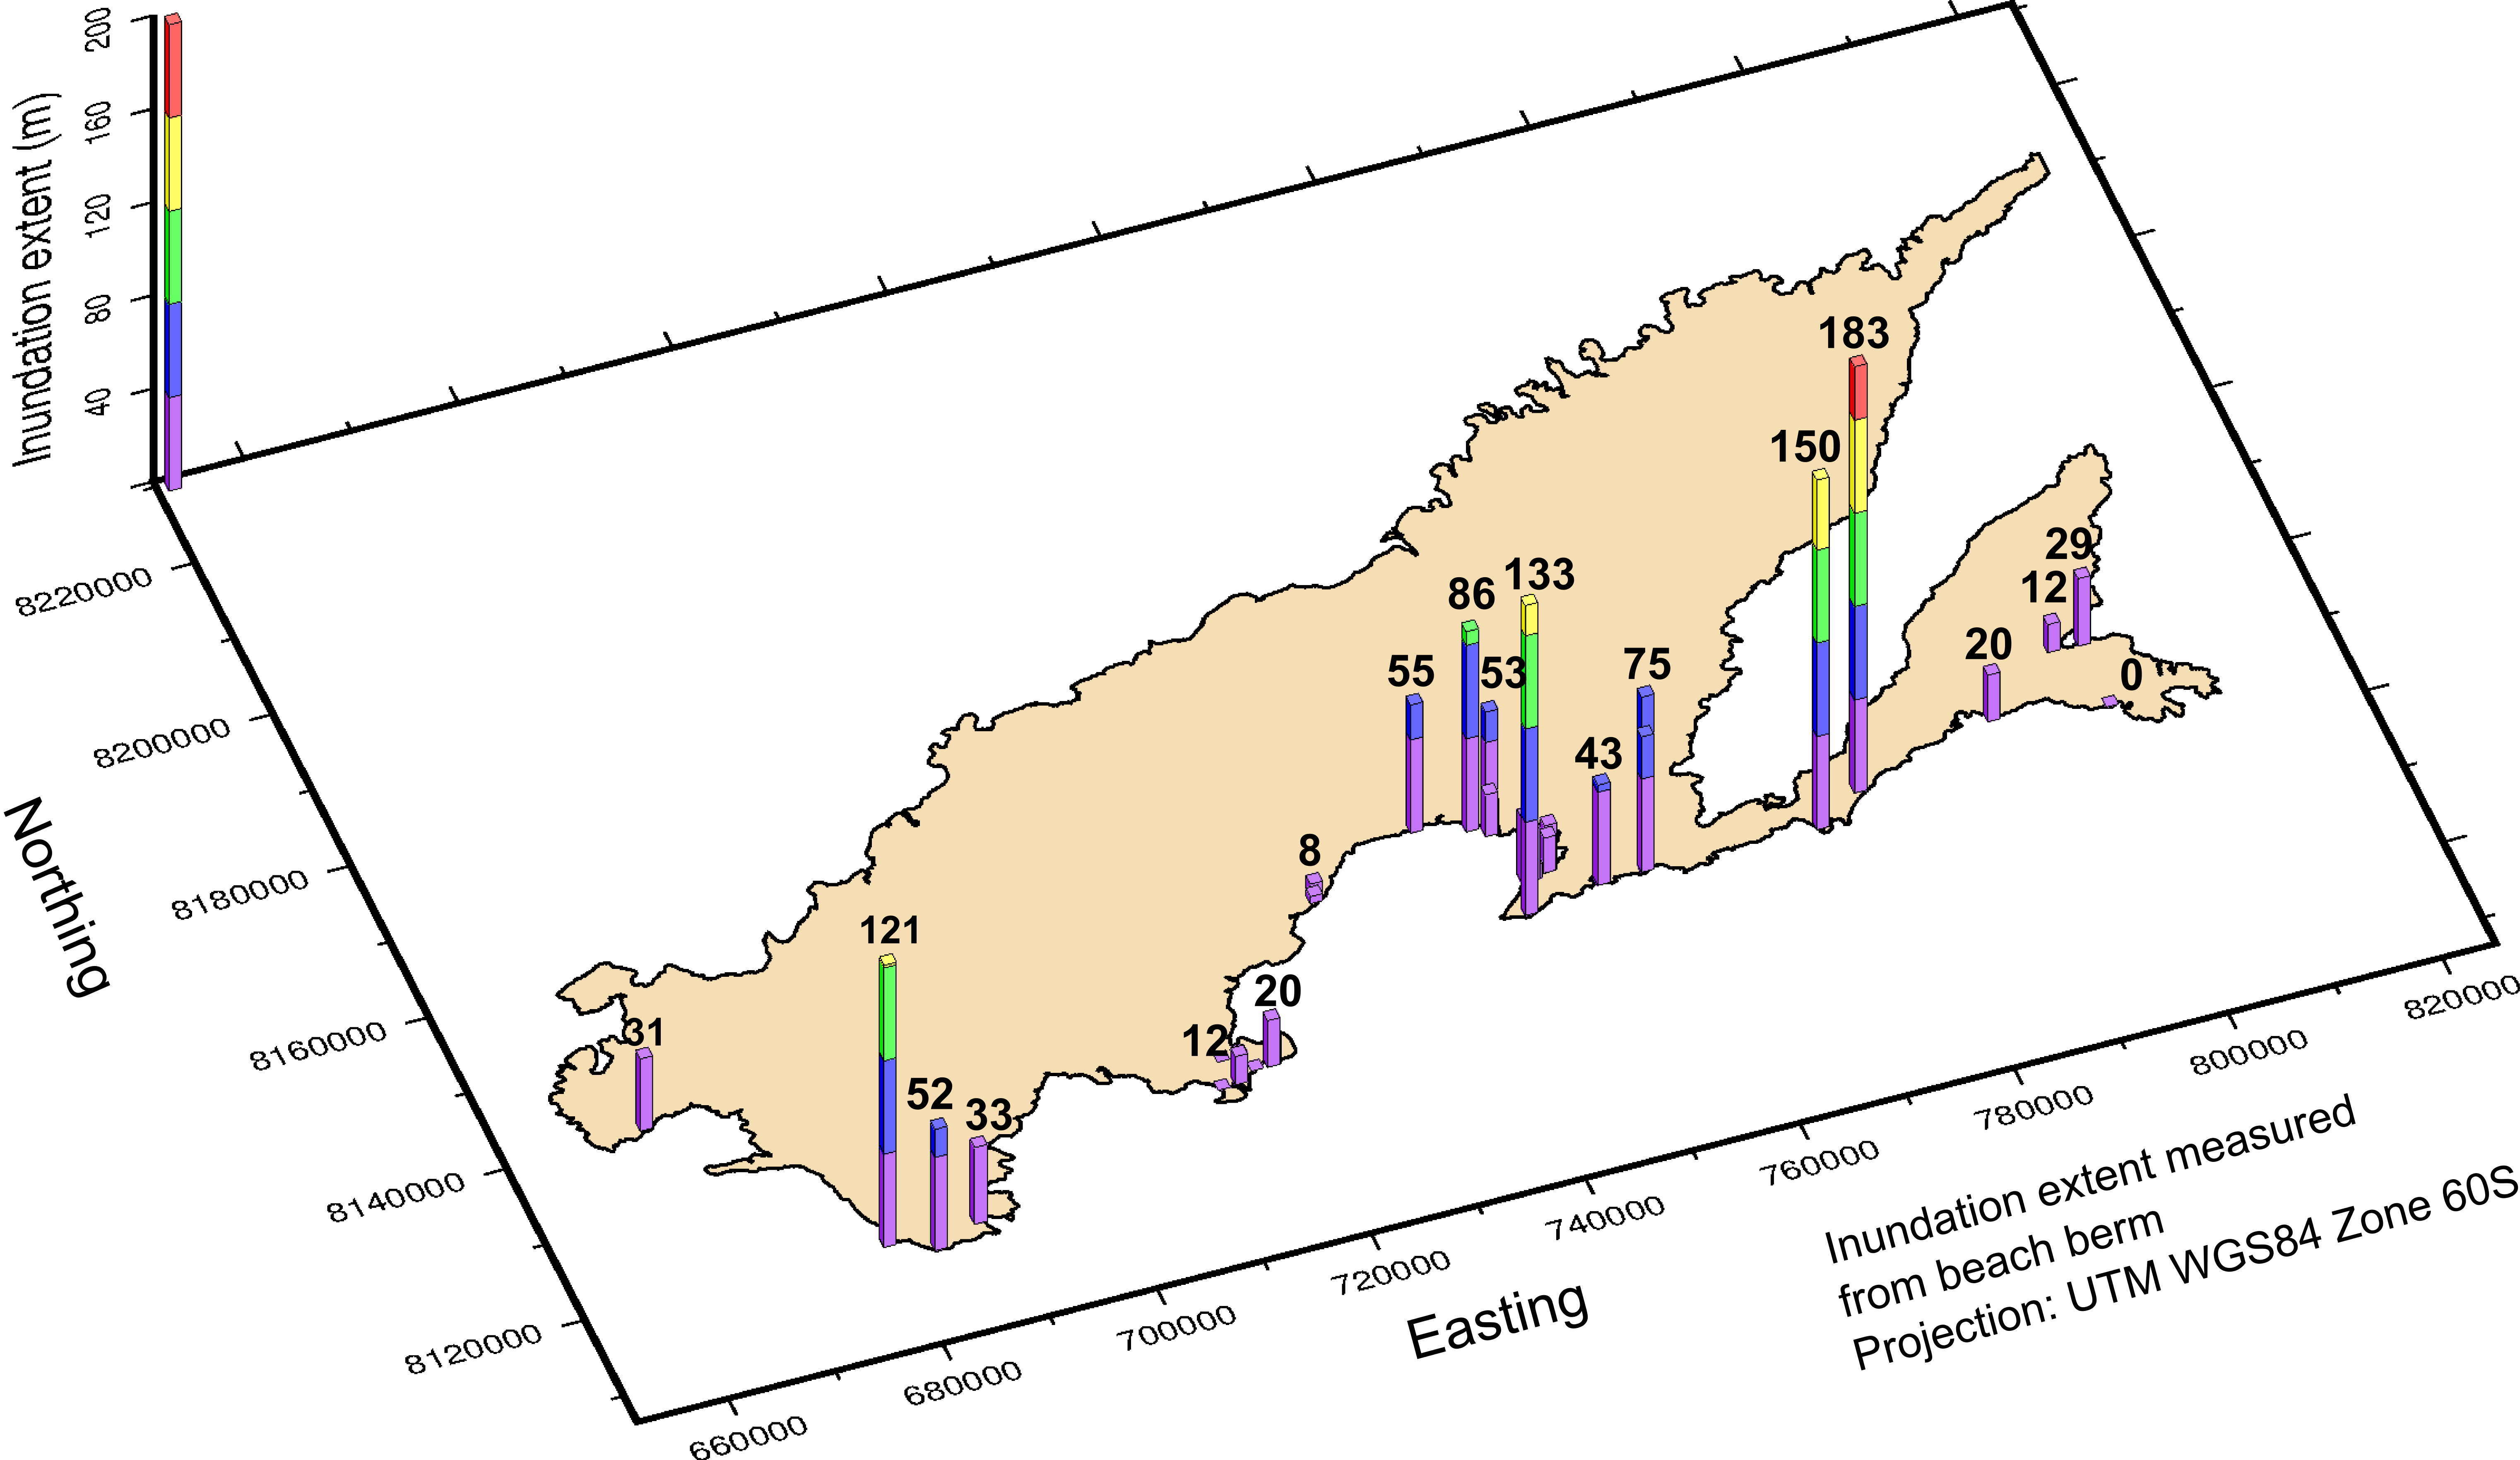

WACOP


Field work pictures


Results

Inundation maps for about 50 villages/settlements were made. The highest run-up recorded in Ovalau was 5.6m above the highest tide of 2015 while in Vanua Levu, it was 2.6m above highest tide of 2015. The maximum inundation extent recorded for Ovalau was 192m and in Vanua Levu it was 183m. The maps below show the maximum run-up and the maximum inundation extent for both the locations.

Ovalau maximum run-up


WACOP

Ovalau maximum inundation extent


WACOP

Vanua Levu maximum run-up


WACOP

Vanua Levu maximum inundation extent


WACOP

Discussion

As seen on the maps above, some parts of the area surveyed had recorded minimal amounts of run-up and inundation extents as these areas were well protected by offshore reefs, while other areas which didnt lie behind reef structures were severely affected by waves and storm surges. The inundation maps that were prepared after these surveys were given to the authorities that were responsible for the decision making on relocating the villages that were affected by the inundation. The maps were also used for community awareness work and serves as a validation for the design of inundation forecasts.

STC Winston, as mentioned above, was the strongest cyclone to ever make landfall in Fiji. According to IPCC Fourth Assessment Report, "future tropical cyclones would likely become more severe with greater wind speeds and more intense precipitation". This evidence can link climate change with the devastation wrecked by STC Winston.


So was STC Winston really the 2nd strongest on Earth?

According to many renowned sources, STC Winston had been declared as the strongest cyclone in the Southern Hemisphere and the second strongest to Super Typhoon Haiyan to ever make landfall anywhere on Earth in recorded history. However, this is all based on the 1 min averaging time for reporting the sustained winds which is mainly used by the World Meteological Organization (WMO). The rest of the world uses a 10 minute averaging time for sustained winds and according to that, STC would be probably one of the top 5 cyclones in the Southern Pacific. If we look at the 10-min averaging time, STC Pam which was also a Cat 5 cyclone which hit Vanuatu almost a year before STC Winston would be declared as a stronger cyclone than STC Winston. Look at the table below for more information on the comparison between STC Winston and STC Pam


Comparison between STC Winston and STC Pam

Cyclone Dates 10 - minute sustained winds 1 - minute sustained winds
Severe Tropical Cyclone Winston 7th Feb - 3rd March 2016 230km/h 285km/h
Severe Tropical Cyclone Pam 6th March - 22nd March 2015 250km/h 270km/h

GIS data

The data that was collected and mapped during the survey are available on PacGeo. Click here to view the data.

SPC also has a Cyclone Winston Spatial Data Resource which can be viewed here